
Several markets across the globe are officially in bear market territory. The U.S. market is not one of them. It’s still in a correction, down about 12% from the all-time high of 2,130 on the S&P 500, recorded on May 21, 2015.
The Analysis
But based on an analysis of “support failures” it’s fair to say that the U.S. stock markets are unstable. What are the odds that the U.S. market will join the others by declining to the 1,700 level, which would put it in bear mode as well? In this article we will try to calculate those odds.
Dwaine Van Vuuren from Recessionalert.com posted this chart on January 19th.
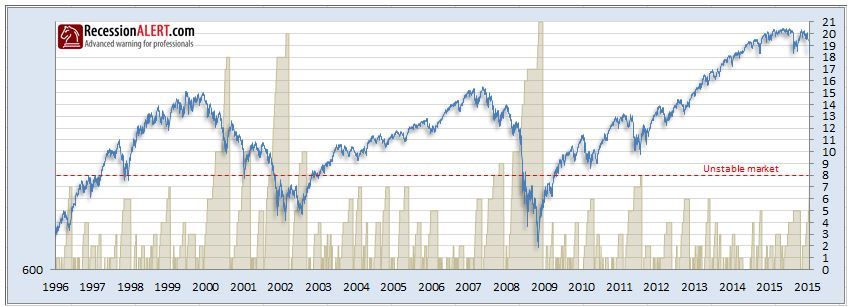
What we see on the chart is the S&P 500 (in blue) plotted against a running count of support failures, as calculated by Van Vuuren. What is a support failure? In simple terms it happens when the market establishes a support level and then trades below it. (See his article for details about how to calculate these support fails.)
The chart shows that over the last 20 years, corrections that saw 8 or more support failures create instability in the market and usually lead to further declines or even a protracted bear market. The chart shows the NewLo count represented by the shaded areas.
Where We Are Now
As of today, the NewLo count is 9, which means that the S&P 500 is now in unstable territory according to this measure. Looking at the history of this indicator over 20 years, the market has declined an average of 20% whenever the count reaches 9. And should the count get to 11, the average decline observed is 37%.
Based on the number of corrections (146) since 1996, and their subsequent outcomes, the odds of a 20% decline (from the May high of 2130) are slightly better than 50-50. But the odds of getting to 11 or more support fails, and seeing a 37% market decline (or worse) is much lower. It has only occurred in 2% of the observed cases since 1996.
Below is Van Vuuren’s chart showing the distribution of support fails, along with average outcomes (and, by inference, their probabilities).
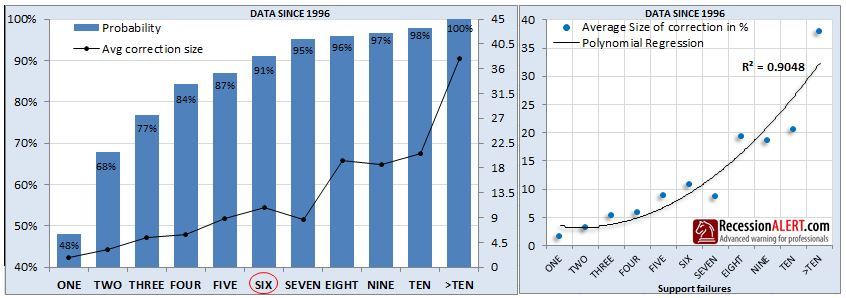
When the above chart was published, the count was 6, as indicated by the red circle at the bottom of the left panel. Today the count is 9, and it’s fairly likely that it will get to 10 before the current correction has run its course. So what’s an investor to do?
What You Should Do
The first thing is… don’t panic. If you’re a long term buy and hold investor, the best thing for you to do now is to ignore the noise and the scary headlines that have permeated the financial media landscape. Why am I so sanguine in the midst of an unstable market? Because there is no recession on the horizon, and market corrections in the absence of a recession tend to be shorter and more shallow than recession-linked episodes.
Secondly, if you have a tactical component to your investment strategy, it wouldn’t be the worst thing in the world if you decided to play a little defense at this point. I’m not talking about selling everything and hiding in cash. I’m talking about trimming your equity exposure by 10% or 20%, so that you can cushion the blow from further market declines, and have some dry powder to work with when this instability runs its course.
Thirdly, if you are an aggressive investor, or you are close to retirement and too heavily exposed to stocks, then go ahead and be aggressive. Take half of your equity exposure off the table, but be warned: the possibility of whiplash is very high, because we humans are notoriously bad at market timing. It may be relatively easy to hit the sell button during times of market stress like we’re witnessing now, but once we’re out it’s much more difficult to get back in. That’s because the news will become even more scary and the predictions even more dire as the market continues to fall. Getting back in requires nerves of steel, because you’re going to be going against the tide. That’s much easier said than done.
What I’m Telling My Clients To Do
For my own clients, I’ve been trimming equity exposure for months. But I’m still advocating 80% of normal allocation levels. If the count gets to 11, I will probably get more defensive, but for now I’m going to observe and wait for the market to tell me what to do.