

For months I've had an uneasy feeling about the sustainability of this great bull run. So many headwinds. So much debt. Such high prices, both for stocks and consumer goods. Two shooting wars. The price of oil ticking higher with every missile strike between the U.S. and Iran. Oil is the currency of this war, and so far we seem to be on the losing end. West Texas Crude is now changing hands at $91.93 per barrel. That should put another dent in the next CPI print.
The Wall of Worry
It's been said that the market climbs a wall of worry, confounding investors all throughout history. I believe that, with one caveat: it can't continue forever. At some point there must be a return to the mean (or close to it) for the market, and today's market is no exception. Making matters worse, the market often overshoots to the downside. I'm not predicting this, but we could be looking at at least a 2022-style decline (about 25%) or maybe something even worse.
I'm still a bull for now, but I am keeping my eye on the exit at all times. I have a plan in place in case the market keeps falling (the S&P 500 is down 93 points as I write this). Do you? If not, you really should write one.
There are mini-bear markets all around us
Let's start with the elephant in the room - Bitcoin. And all of the competing cryptos out there. Bitcoin is trading at $64,670 as I write, down 26% year to date, and down 48% from its September 2025 high. That's a lot of pain for such a popular product. But the total market cap of all the Bitcoins in existence is just $1.3tn, compared to the Fed's balance sheet of $6.7tn. Bitcoin is only one of many assets, sectors, groups, ETFs, and individual stocks that are currently in bear markets. Let's have a look at some of them.
ETFs
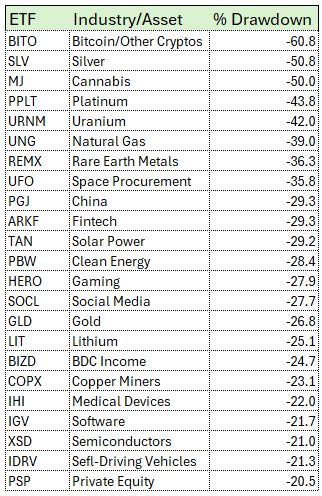
Glancing at the table below shows the extent of the stealth bear market that we may or may not be in. It starts with Bitcoin, which we've already addressed, then chews through silver, gold, platinum, lithium, and uranium, to name a few important metals. Even the Rare Earth ETF is in a bear market. Makes you wonder how "rare" these rare earth metals really are, doesn't it?
Cannabis has been a terrible investment since the early days, so there's no surprise there. But Natural Gas is a head-scratcher. Oil at $91 makes natural gas look very attractive, so why is it in a slump? I'll leave that to you energy analysts out there.
China has been struggling for years when it comes to their stock market. Social Media, one of the most attractive meeting places for the younger generations, is also in a bear market. But the big one is software.
Not very long ago, software firms were kings. They had fat margins and captive clients who generated recurring revenue. Now, with the rise of AI, the value of software has been called into question. AI can do many things that used to be done with software. Especially agentics, which can ride along with an Excel spreadsheet or a Word document. There go the fat margins, and the stock prices along with them.
Individual stocks
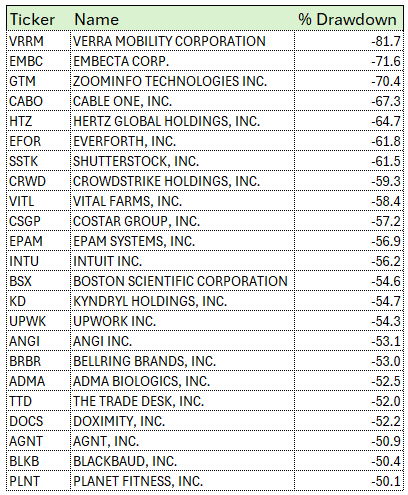
One of the features of our current market regime is the wide dispersion of returns among equities and other tradable assets. This wide dispersion is especially pronounced in the momentum category, where many of the AI superstars live. For example, Hertz (the car rental company) is down nearly 65% from its high, as they have cut forward guidance and are borrowing heavily to finance operations.
Intuit (INTU) is down 56%, and the list goes on. Keep in mind that this table only shows some of the stocks that are down by 50% or more. There are 88 stocks that made this list, but it was too long, so I clipped it.
What you can do to prepare for the main event
Think of today's selloff as a warmup to the final event - date TBD. We all know it's coming, but it's ridiculously hard to predict when. It's even extremely hard to recognize it when it's upon us. I have a set of indicators that I watch, so that I can gauge the health of the market. I'm sure you have your own favorite indicators too. Now is the time to pay attention to those indicators, because the rumbling beneath the surface of the market is palpable right now.
Not to sound like a broken record, but the first thing you can do to prepare is to make a plan. That means putting it in writing, updating it as conditions change, and keeping it handy so you can grab it when the time comes.
Part of my plan is a grid of indicators and cash bands. I have 8 primary market indicators, plus an economic overlay, that feed a running score. As the score begins to drop, my cash level goes up in 5% increments. At my most bearish, I max out at 30% cash. I do this because I'm looking for an edge, not swinging for the fences. I tried that many years ago and paid dearly for it.
I also identify the stocks that I will sell (or trim) first, second, third, etc. So there is no guesswork involved. That is, if you keep your plan up to date. That is the key. A stale plan will only take you so far, and you will end up second-guessing what you wrote at the time. At that point, you might as well have no plan at all.