
Introduction
Bear Markets are the bane of the investor, with two exceptions: professional traders who specialize in short-selling, and regular investors who have a particular skill. Namely, they have learned how to tell the difference between market declines that are linked to a recession, and those that are not.
Those who have mastered this skill are able to sidestep most of the damage that bear markets visit on investors. Their reward is higher returns, less volatility, and significantly more wealth when it's needed.
Those who lack this skill have other options for managing risk. They can let their gut tell them when to play defense. They can use a mechanical approach, like a moving average crossover system. Or they can just stay invested throughout these bear markets. Most investors will stay in the market by default. It's the easiest path to take. But is it the best?
In his classic investment book Stocks For The Long Run, Wharton professor Jeremy Siegel points out that almost without exception, the stock market tops out prior to business cycle peaks and bottoms out prior to cycle troughs. Out of the 47 recessions since 1802, 43 (9 out of 10) have been preceded (or accompanied) by declines of 10% or more in the stock market. This is the core idea that drives this inquiry into the link between bear markets and recessions.
Anatomy of a Bear Market
In this article I will examine 10 historical market declines in an effort to better understand how markets react to threatening events. With the heightened tensions between the U.S. and North Korea, I chose the Cuban Missle Crisis as an analog.
To understand how wars impact the market, I chose Desert Storm and Pearl Harbor as examples. I also included the Greek Debt Crisis from 2011, the non-recession Crash of 1987, and a few classic recession-linked bears, such as 2000 and 2008.
Before we get into the individual events, take a look at the following two tables which list all of the bear markets starting with the infamous crash of 1929. Pay particular attention to the last column - the number of years it took for the market to regain its pre-bear price.
Table 1. Bear Markets linked to economic recessions
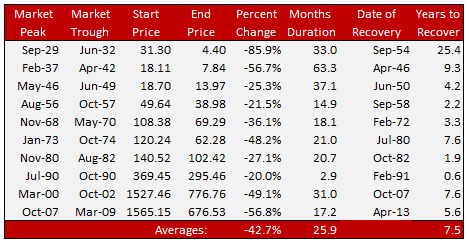
On average, recession-linked bear markets inflict losses of ~43%. They waste 7.5 years of your life just getting back to even. Ask yourself - is staying in the market for 7.5 years so you can get back to even a reasonable choice?
Table 2. Bear Markets not linked to economic recessions
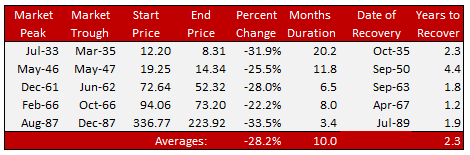
The difference between recession and non-recession bears is dramatic. 28% average loss, compared to 43%. 2.3 years to get back to even, compared to 7.5 years. Most investors, myself included, will choose to stay invested and ride out these non-recession market declines.
10 Notable Market Events
Now let's look at all 10 of the market events, beginning with the MOAB - the Mother of All Bears - in 1929 (and the Great Depression that followed).
Chart 1. 1929 - The Mother of All Bear Markets
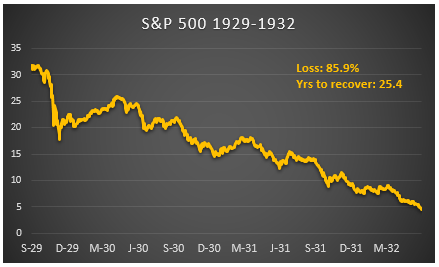
I call this the mother of all bears because it's the worst bear market in U.S. history. A crash to end all crashes. People were jumping out of windows because they realized they were ruined financially. What began as a routine recession soon turned into the Great Depression. 25% unemployment. Bread lines and soup kitchens. This went on for ten years.
What is unique about this event is that it's the only example of a bear market causing massive economic damage. In all other cases, bear markets are a reaction to a recession, not the cause. Could a bear market of this magnitude happen again?
Unfortunately, yes it can. There were safeguards put in place in the aftermath of this crash, and they worked, in the sense that we have not had another depression since then. We came pretty close in 2008, but managed to pull back from the brink just in time.
Chart 2. 1941 - The Pearl Harbor Bear
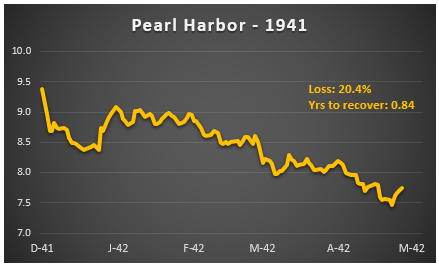
Pearl Harbor took nearly everyone by surprise. December 7th, 1941 was "An event that will live in infamy" in the words of Franklin Roosevelt. It precipitated a bear market. But amazingly, it barely qualified as a bear market. And it took less than a year to recover.
One of the lessons I learned from this event is that geopolitical shocks, even as devastating as this one was, don't necessarily lead to economic depression or massive bear markets. The stock market took a hit, and investors fled in droves, but the economy did not roll over. As the U.S. geared up for war, the economy started to grow faster. The stock market reflected this by rallying back to its pre-Pearl Harbor highs in less than a year.
Chart 3. 1961 - The so-called 'Kennedy Slide'
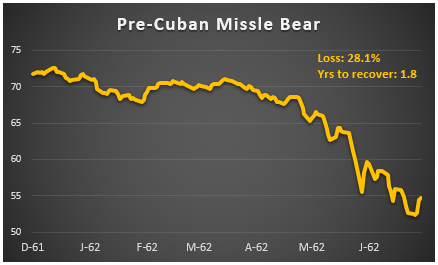
In the lead up to the Kennedy Slide of 1962, the economy was booming. Stock prices had been on a steady rise since the late 1940s, and when John F. Kennedy took office in 1961, he promised that the good times would continue. Then, in typical fashion, the stock market handed Kennedy a sharp decline. Through June 1962, the S&P 500 experienced a 28% decline, with the major market indices dropping almost 40% on May 29, 1962 alone.
Some historians refer to this event as the "market break of 1962." Pundits at the time blamed the decline on excessively high valuations and earnings warnings from a few high-fliers like Texas Instruments and Polaroid.
Chart 4. 1962 - The Cuban Missle Crisis
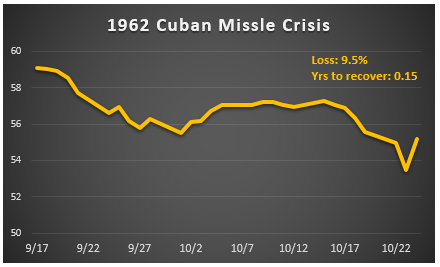
Why am I including a market decline of just 9.5% in an article about famous bear markets? Because it has relevance to the situation we find ourselves in today.
North Korea is doing what the Soviet Union did back in 1962: threatening the United States with nuclear missles. So far our stock market has not reacted to this threat, and there is historical precedence for this non-response, as the Cuban Missle Crisis illustrates.
One significant difference between these two incidents is that the Cuban Missle Crisis only lasted 13 days. Nikita Khrushchev backed down, and the crisis was over. This is not the case today. Kim Jong Un is not likely to back down from President Trump's warnings anytime soon.
So investors today have a dilemma on their hands. Should they take their cue from history, and bet that this crisis will be averted, and the stock market will only suffer a minor correction? Or should they take their cue from the dangerous combination of a rogue state with nuclear capabilities squaring off with an inexperienced, impulsive president who desperately needs to look strong and get something in the win column? You decide.
Chart 5. 1973-74 - The Oil Shock Bear

The 1973-1974 bear market seemed to go on forever. The S&P 500 began 1973 at a price of 120. But then, in a series of shocking events, war broke out in the Middle East, OPEC quadrupled the price of oil, Richard Nixon resigned over the Watergate scandal, and inflation hit an annual rate of 12.2%. By December 1974, the S&P had plunged to 62, a 48% drop from top to bottom.
“It was like a mudslide,” says Ralph Wanger of the Acorn Fund, which lost 23.7% in 1973 and 27.7% more in 1974. “Every day you came in, watched the market go down another percent, and went home.”
The oil price shock caused gasoline shortages, a sharp spike in inflation, and an economic recession. There was no place to hide.
Chart 6. The non-recession Crash of 1987
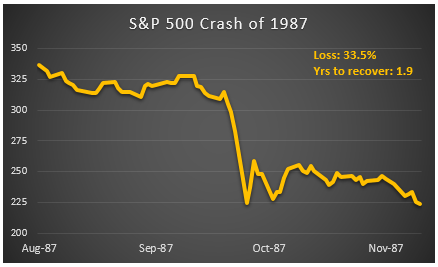
The crash of 1987 was unusual for a couple of reasons. First, it featured the worst one-day market decline in history. It began on Black Monday - October 19th. That day, the Dow Jones Index dropped 23%. That magnitude of decline had never been seen, before or since, including during the crash of 1929.
Second, there was no recession following this historic crash. The market eventually lost 33% of its value, but it took less than two years to fully recover. At the time, I was sitting on a trading desk at Kemper Securities. My memory of this event was that it was surreal. It felt like a slow-motion car crash. We couldn't get any trades done because the brokers refused to answer our calls. Nobody wanted to step in front of this freight train. Bids disappeared and prices were in freefall.
I think the crash of 1987 has great relevance to our current market. It was triggered by nothing particularly earth-shattering, but once it got started, computer algorithms kicked in and the selling became a tsunami. The more the market fell, the more the computers wanted to sell.
Does this sound familiar? Today's market is dominated by computer-driven buy and sell orders. We have already had several 'flash crash' episodes since 2000. As long as the regulators keep turning a blind eye towards the danger of unrestricted computer trading, the risk of another 1987 is clearly present.
Chart 7. Desert Storm
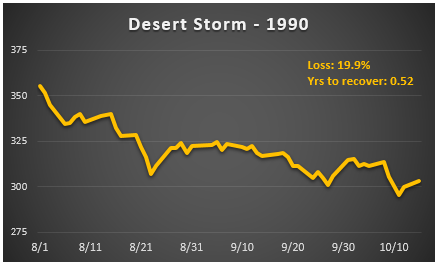
The Desert Storm event is another example of the way markets react to threats- domestic, foreign, financial, economic, or political. This episode was related to, but not necessarily caused by, the drumbeat of a war in the Middle East. By coincidence, the U.S. economy had just entered a recession as the war got started.
My view is that this bear was caused by the recession of 1990, and accelerated by the war.
Chart 8. The bursting of the Tech Bubble
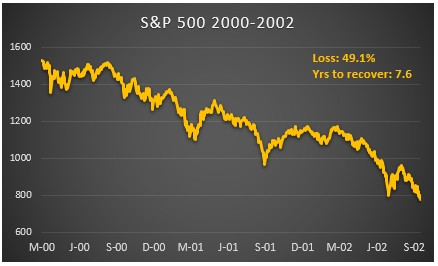
One of the distinguishing features of this recession-linked bear market is the fact that investors had become convinced that we were in a new era - the internet era - and that the bull market that began after Desert Storm would continue indefinitely.
Just as they did in 1929, investors bid up stock prices to levels well beyond any rational justification. In fact, investors in 2000 went even farther than their 1929 forebears. Just before the bottom fell out, the S&P 500 was trading at a P/E ratio of 28 times. The long-term median P/E is 14.66.
This was a massive bear market. Several factors combined to create it. The technology bubble finally burst. A recession hit the economy. And 9/11 happened. By the time it was all over, investors had lost half of their portfolio values. It took 7.6 years to get back to even.
Chart 9. The Global Financial Crisis
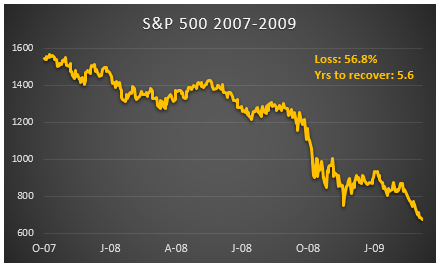
In one of the stock market's most diabolical maneuvers of all time, it gave investors just a few weeks to enjoy their return to profitability before bringing the hammer down again. Only this time, the damage was even worse.
Thanks to a deadly cocktail of an historic housing bubble, fueled by easy access to credit, and new instruments of mass financial destruction like Liar Loans, MBS, CDO, Credit Default Swaps, and the ATM-ization of home equity, the subprime mortgage market was the first domino to fall.
One falling domino let to the next, and when the smoke finally cleared there was a sense of relief that another Great Depression might be avoided after all. It took 5.6 more years to recover from this bear market, which can reasonably be combined with the 7.6 years it took to recover from the previous bear. All told, these two bears cost investors half their savings, and wasted a combined 13 years of their lives just getting it all back again.
Chart 10. The Greek Debt Crisis
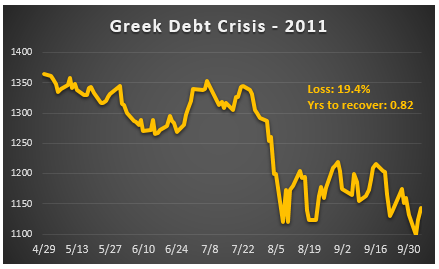
The last event on our list is the near-bear market of 2011. Technically, it doesn't qualify as a bear market because it didn't get to -20%. But it was bad enough to send investors rushing for the exits, especially because the wounds from the last two bears were still fresh.
But there was no financial meltdown in Europe, and no recession in the U.S. That helped the market to achieve a speedy recovery that only took 0.82 years.
How to turn this information into an advantage
An investor who is aware of where we are in relation to the business cycle, and who is able to take advantage of this awareness by adjusting their exposure to risk accordingly, will have an unfair advantage in the market. The question is how to make the most of it. The answer will be different for every investor.
The list of recession forecasting services that are robust enough to provide reliable signals is a short one. These services have enviable track records, both in-sample and out-of-sample. I have my own forecasting model that I developed in 1980 and have been using with clients ever since. I would put it up against any other model available today, but my advice to you is to do your own vetting and choose the model that makes the most sense for your situation.
Here are the top 3 recession forecasting models that are accurate, affordable, and available:
Recession Alert . Dwaine van Vuuren. $425/year. Mentioned by Doug Short, Jeff Miller, and John Hussman.
No Spin Forecast. Dr. Robert Dieli. $1,100/year. Mentioned by Jeff Miller and Georg Vrba.
Zen Investor NFP. Erik Conley. $350/year. Contributor on SeekingAlpha, MarketWatch, and The Wall Street Journal.
Some final thoughts
"All I want in life is a small, unfair advantage." -Former AIG chief Maurice R. "Hank" Greenberg
If you want to build meaningful wealth as an investor, you're going to need some kind of an edge. For Hank Greenberg, it was an uncanny ability to bend the rules while outmaneuvering the insurance regulators. Warren Buffett has an edge, too - exceptional skill coupled with access to cheap money. While edges like these aren't readily available to most investors, there is something that can provide a significant edge to you, right now. I call it situational awareness.
Having the skill of situational awareness will put any investor in a better position to manage risk and boost returns. In a way, it's like counting cards at the Blackjack table. Knowing when the deck is full of 10s gives the player a distinct advantage over the dealer, who must take a hit until he has at least 17. Or playing high-stakes poker against an opponent who giggles uncontrollably whenever he's bluffing. In both cases, you have a significant information advantage. How you bet depends on who you are as a player.
However you choose to use this edge is up to you. But you might as well capitalize on your unfair advantage.
In my next article on this topic, I will go into more detail about my recession forecasting model. I will also show what the model was forecasting before each of the 10 market events I covered in today's article.
The purpose of my next article will be to give you a better understanding of what situational awareness means, and how to use it. There will be 10 case studies, and everything after 1980 will be out-of-sample and based on real-time data.