
Examining the best and worst ETFs can be instructive. Nothing succeeds like success. At least that’s what many people believe about making progress in their careers. But in the stock market, a different force is often at work that contradicts this old saw. It’s called Reversion To The Mean. In a nutshell, it means that last year’s winning stocks, ETFs, asset classes, or strategies are likely to suffer a reversal of fortune and show up on this year’s loser list.
I happen to believe that reversion to the mean is a real and significant force in the capital markets, and investors can take advantage of it by betting against past winners while betting that past losers will recover and outperform in the future.
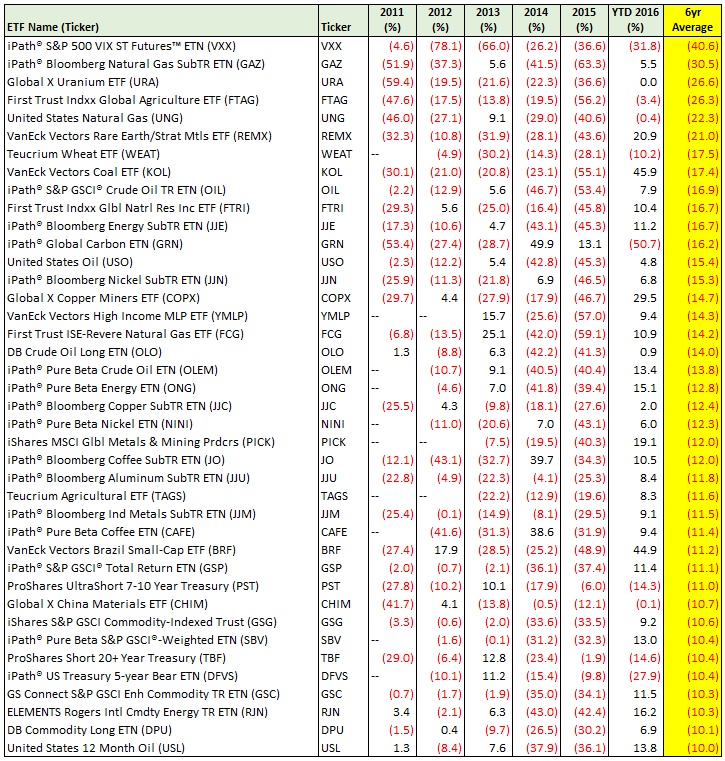
One way to explore this thesis is by looking at the performance of various asset classes, as represented by ETFs that track their performance. Following is a list of the best and worst ETFs over the last 5 3/4 years. The idea is to view the biggest winners as being vulnerable to a reversal of fortune, and the biggest losers as being ripe for a rebound.
Table 1. Best performing ETFs from 2011 to today. Excludes leveraged and inverse products.
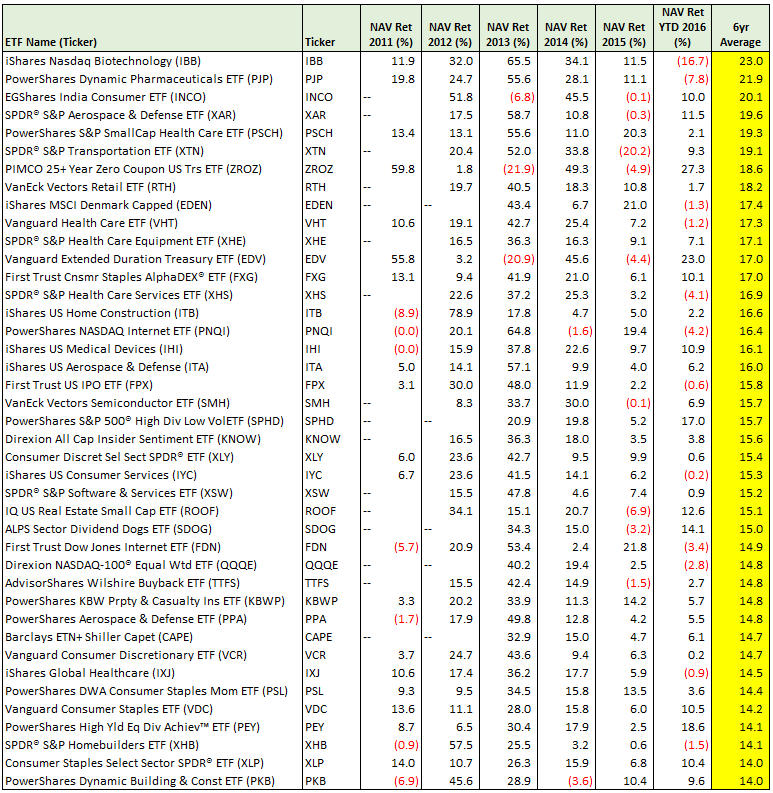
Table 2. Worst performing ETFs from 2011 to today. Excludes leveraged and inverse products.
One way to use the information contained in these lists of the best and worst ETFs is to look for signs of reversion to the mean. You can do this by looking into technical indicators like relative strength, momentum (moving average crossovers), or up/down volume.
For trading strategies, you could do a long/short pair trade. Go long the loser and short the winner. Another idea is to use the options market (assuming there are options available) and buy calls on the losers and puts on the winners.
If you’re more of a long-term investor, you can use these lists as a way to assess the longer term trends in the market. Another market cliche is that trees don’t grow to the sky. An asset class that has been on a 6 year run – in either direction – is more likely to reverse than one that has no such trend.
One thing that I notice from these lists is that the winners are populated by cyclical and growth asset classes, while the losers are populated by natural resource and basic industry asset classes. At some point, these trends are likely to reverse. But nobody knows when it will happen. By paying attention to early signs of trend reversals, using moving average and relative strength metrics, you might be able to get ahead of the next sea change in the markets.