
“Once more unto the breach, dear friends, once more;
Or close the wall up with our English dead!
In peace there’s nothing so becomes a man
As modest stillness and humility:
But when the blast of war blows in our ears,
Then imitate the action of the tiger.” ― William Shakespeare, Henry V
Shakespeare’s Call For Courage
This phrase appeared in Shakespeare’s play, Henry V. The scene begins in the middle of the blockade of Harfleur, as King Henry’s army has blown up some French fortifications. He encourages his army to attack the city again by uttering these famous lines.
The literal meaning of this phrase is let us try one more time. King Henry speaks this phrase to encourage his soldiers to attack again and show courage. In common parlance, the phrase means that one goes into the battle again, whether a real battle on the battlefield, or a battle against some injustice of daily life; it is always try again.
The Brexit Breach
The Brexit vote blew a hole in the wall that surrounds the European Union. The explosion sent shock waves across the globe, as capital markets fell in unison. There was a flight to safety, as investors dumped risky assets like stocks and sought comfort in safer ones, like Japanese and U.S. government bonds. The reaction was swift and logical, because the worst enemy of investors everywhere is uncertainty. Brexit brings with it a level of economic and political uncertainty that reasonable people should not underestimate.
A Call For Courage
With this background of great uncertainty causing global investors to flee risk and seek safety, what should U.S. investors do now? The first step is to refrain from making radical changes to your portfolio based on heightened anxiety caused by uncertainty over what’s coming next. This is not to say that you should simply do nothing at all. I’m saying that any changes you are considering should be based on thoughtful reflection rather than emotional reaction.
Let’s Look At The Numbers
With this in mind, let’s take a look at what has happened in the past when significant geopolitical events like Brexit have caused a strong reaction in the capital markets. I looked at the biggest one-day declines in the S&P 500 since 1950, and asked two questions – what happened to stock prices in the 30 days leading up to the event, and what happened over the next 30, 90, and 365 days after the event. This gives us a sense of historical perspective, which helps us to put the Brexit selloff in context.
How significant was Friday’s Brexit selloff?
The S&P 500 was down 3.6% on Friday. How significant was that? Of the 16,730 trading days since 1950, it ranked as the 58th largest decline. That’s significant. (The worst one-day drop was October 19, 1987. The market was down 20% that day.)
The 58 worst days since 1950
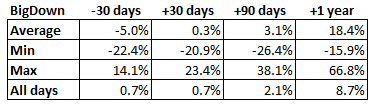
Looking at the worst 58 days in the stock market, what was happening in the 30 days leading up to the big drop? On average, the market was down 5% over the prior month. One way to look at this is to say that the big drop was not entirely unexpected. In a typical month, the market is up 0.7%. So a 5% decline in a month is significant. The conclusion I draw from this is that investors were worried that something bad was coming and they were selling stocks in anticipation of the event.
Brexit caught investors napping
What was happening in the 30 days leading up to last Friday’s market rout? The market was UP 1.8%. This tells me that investors did not expect the Brexit vote to pass, and the market to take a big hit as a result. This is confirmed by numerous media reports, based on polling numbers and betting markets, that carried a common theme that although the vote would be close, the remain camp would win the day. Investors seemed to be blindsided in this case.
What happens after a big drop?
Now let’s look at what has happened in the past after the big one-day declines in the market. Of the 58 largest declines, the average change in the market over the next 30 days was a gain of 0.3%. Let’s just call this a flat market. But it’s significant that the market was not down, as logic would lead many of us to expect. Looking at the details, some events produced declines (the worst was -21% after the Lehman collapse in 2008), and some produced gains (the biggest was a gain of 23% in the 30 days following the bear market bottom of 2009).
Looking at the 3 month figures we see more of the same. The average market move was a gain of 3.1%, compared to the average 3 month move for all days since 1950 of 2.1%. It’s fair to say that the market has performed above average in the 3 months following sharp one-day declines.
Finally, let’s look at what has happened a full one year after these 58 big declines. On average, the market was 18.1% higher than where it began. When you compare that to all one-year periods since 1950 – a gain of 9.2% – it’s clear to me that a big one-day drop like we saw last Friday does not, in and of itself, foretell a bad year to come for the stock market.
Conclusions
So let this review of history give a modicum of comfort to those who assume that dark days must lie ahead. But let’s not be overconfident, either. When the market dropped 4.9% after the 9/11 terrorist attack in New York, it was down nearly 16% one year later. That could certainly happen again. But looking at the long arc of market history can, and should, take some of the abject pessimism out of the equation as you contemplate possible changes to your portfolio in the days and weeks ahead.
Steady as she goes, and once more unto the breach, dear friends.