
What will equity returns be for the next 10 years?
Beware of Seers, Soothsayers, and Forecasters who predict equity returns for the next 10 years with an air of certainty
When it comes to forecasting equity returns for the next 10 years, there is no such thing as a crystal ball. Predictions about what will happen to stock prices are simply vanity statements from pundits and strategists who want to get some attention.
Regardless of this self-evident truth, there is a time-honored tradition on Wall Street where highly respected and well-known strategists and assorted talking heads offer their visions about the future. The thing that galls me is that these pundits offer their predictions with an air of certainty and authority, as if they have tapped into the hidden matrix of the market and know what’s coming next.
They don’t just predict the direction of the market or the economy, they go one step further and predict the future price or the growth of the economy 12 months hence. They predict other key numbers, like interest rates, unemployment, the price of oil and gold. And one of their favorites is forecasting the rate of inflation. Why do these high-profile experts stick their necks out with these predictions?
My guess is this. Everyone in the business knows that the only thing the media cares about is which of the predictions were the most accurate. These lucky guessers are celebrated in the financial media, and their reputations get an upgrade.
Those who were off the mark don’t get punished. They are simply ignored. Therefore, there is no downside for making predictions. Shows like CNBC and Bloomberg News will congratulate these lucky pundits on their skill and prescience and ask how they knew that things would turn out the way they did. This media attention not only burnishes their image, it also gives them bargaining power when it comes to renegotiating their compensation package.
Remember – there is no punishment for being wrong, even horribly wrong. There is only the possibility that the stars will align with their predictions, and they will enjoy their 15 minutes of fame.
Everybody loves an entertainer
Why do you think Jim Cramer is so popular? Because his predictions are accurate? Or could it be because he makes his predictions every night, and he exudes confidence and certainty. The Great Unwashed love this guy, even though his stock picks are only correct 47% of the time. They love his enthusiasm; they are impressed with his encyclopedic knowledge of companies; and they long to be part of the Cramer Nation. Have you listened to the people who call in to his show?
I’m not saying that Cramer is a phony or a huckster. I’ve talked to him, and I think he is brilliant. His intentions are good, and I think he believes he is helping ordinary folks make money in the market. But when the cameras are on he’s an entertainer, and he’s the first one to admit that.
This is a critical point for investors. How can you tell the difference between an entertainer who is selling books, advertising, or speaking engagements, from a serious and thoughtful student of the market?
The value of forecasting increases over time when done thoughtfully
Anytime you hear a pundit make a prediction about where the stock market will be 6 months from now, remind yourself that this is almost pure speculation. If the pundit is well-respected in the investment community and has been around for at least the last 3 complete market cycles (that would be since 1990), then his or her credibility deserves an upgrade from pure speculation to informed speculation. It’s still speculation. But things begin to improve as we look further out on the time horizon.
When we look ahead 12 months or more, the value of a well-thought-out forecast begins to improve. And it continues to improve as we lengthen the time frame. But there is a natural limit to forecasting. At about the 10-year mark, the accuracy (and therefore the value) of a forecast starts to peak because anticipating the health of the economy is pure guesswork at that point.
I prefer to operate within this one-to-ten-year time frame when it comes to making forecasts. I designed my forecasting models to reflect this. This article explores the accuracy and reliability of 10-year forecasts. We begin by looking at the historical record, so we can establish a baseline.
A Look at the Historical Record Over the Last 120 Years
Equities have delivered the following annualized returns since 1900:
• 6.12% nominal, price only.
• 9.48% nominal, including dividends.
• 3.06% real, price only.
• 5.67% real, including dividends.
[Nominal is before taking inflation into consideration; Real is after adjusting for inflation.]
Before we go any further, let’s all try to agree on one thing. The only returns that matter are real total returns. Why? Because the whole point of investing (putting your life savings at risk) is to accumulate real wealth, net of inflation. Real wealth is defined in terms of purchasing power, not as net worth.
It does not matter very much if you earned a nominal return of 9.5% over the last 10 years if inflation was 12%. You gained nominal wealth, but that was just a number on your brokerage statement. What matters is that you lost real wealth because your cost of living went up faster than your savings account balance. When the day arrives that you begin taking money from savings to finance your golden years, you will be worse off if your nominal returns didn’t beat the inflation rate by a healthy margin.
The Equity Risk Premium
You can see from the 120-year record that equities have delivered one thing with consistency. They have produced returns that beat the inflation rate. Another way to say that is that they created real purchasing power. The equity risk premium is the higher return an investor receives, above the so-called riskless rate.
If an investor wants to protect his or her savings above all else, the ideal investment would be U.S. Government paper – Treasury bills, bonds, notes, TIPs, and the like. The problem with this approach is that government paper does not always keep up with inflation. And it has historically lagged equities by roughly 3% per year. So, the trade-off for gaining safety is low returns and possibly a loss of purchasing power.
Now that we know that the only way to build real wealth, in terms of purchasing power, is by taking risk. What follows is a series of charts that illustrate the average returns for equities over the long-term. We look at equity returns from several perspectives: Nominal, Real, Price only, and Price plus dividends. We break the 120-year historical record into decades, so we can compare and contrast the widely varying performance numbers.
The Historical Record
First let’s look at average annual nominal returns, excluding dividends, since 1900.
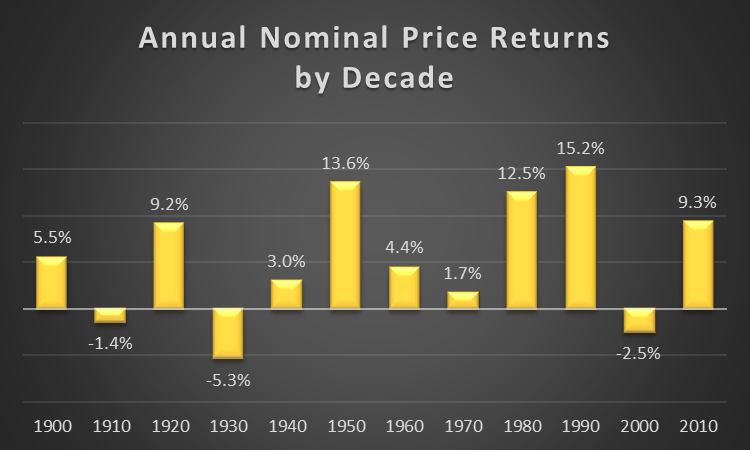
This is the chart that most investors are familiar with. It shows the nominal returns of the stock market (before inflation and excluding dividends). A few things jump out for me. First, the average returns are very different for each of the ten decades under consideration. While it’s true that the average of the returns over the entire period was 6.12%, the variability of those returns is quite high. For example, investors in the 1930’s and 1940’s suffered the effects of the Crash of 1929, and the Great Depression that followed. It was not a good time to be invested in the stock market.
Those who were unlucky enough to have begun investing at the turn of the 21st century suffered through the lost decade of the 2000’s. But investors in the 1980’s and 1990’s hit the jackpot. They were lucky enough to be in the market during the best 20-year stretch in history.
My takeaway from viewing this chart is that when it comes to the stock market, timing is important. It’s difficult to know what’s in store for any coming decade, but it’s not impossible to know. Later in this article I will offer some ideas about how to be more invested in the good decades, and less invested in the bad decades.
Next let’s look at average annual real returns, excluding dividends, since 1900.
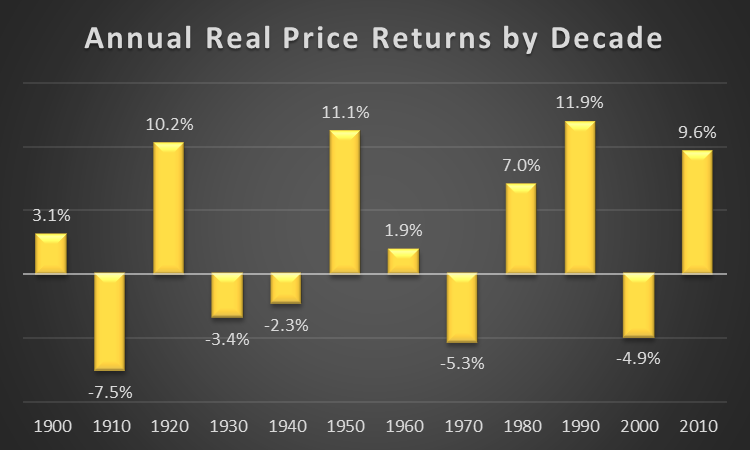
The chart above uses the same numbers as the previous chart, with one exception. This chart takes inflation into account, so we can see the dampening effect of inflation on the gains/losses in purchasing power over the decades.
The first observation is that the average return for the entire 120 years has dropped from 6.12% to 3.06%. That means inflation cut purchasing power in half. Our account statements showed a return of 6.12% but our real return was half of that.
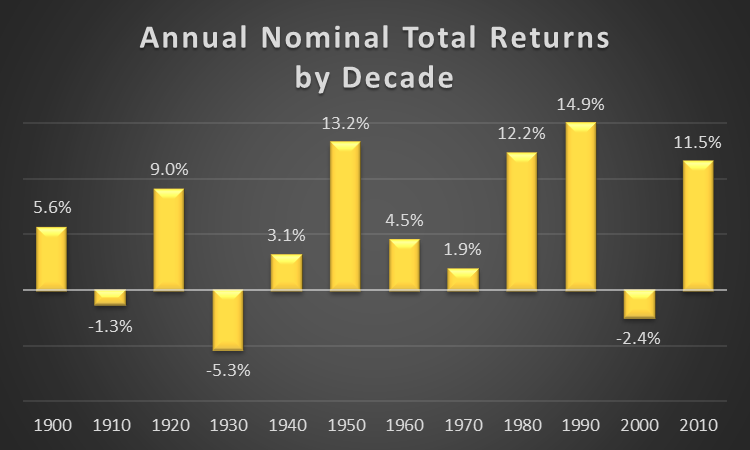
Next is the average nominal total returns, including dividends, by decade.
Finally, here is the average real total returns, including dividends, by decade.
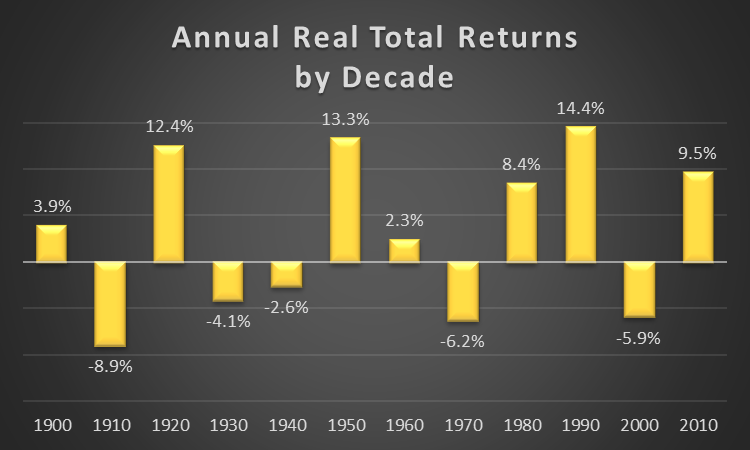
What jumps out at you from these 4 charts? The first time I saw them what struck me was the number of decades where the 10-year real returns were negative. 7 decades saw positive returns, while 5 decades saw negative returns. This not only surprised me, it inspired me to focus my research on the causes of these lost decades and possible defensive strategies that could be used to dampen them.
What was the cause of these decade-long negative returns? Was there a way to know, ahead of time, that the prospects for the market over the next 10 years was bad? These are the questions I pondered.
So, I set about investigating these issues. What I found was very valuable. Specifically, that there is a way to know, with a high degree of confidence, when the market is entering a period of under-performance that could reach a negative 10-year real return.
What I found was a way to use Bayesian Probability Analysis to
forecast the likelihood of bear markets and economic recessions.
Setting the table
According to my research, there are 3 primary drivers of equity returns:
1. The dividend yield
2. The rate of earnings growth
3. The expansion or contraction of the Price/Earnings ratio
All other factors that influence stock prices eventually get reflected in these 3 primary drivers. John Bogle, the founder of Vanguard and inventor of the index fund, summarized the influence of these drivers in the table below. I find it enlightening, and I incorporate his thinking into my forecasting models.
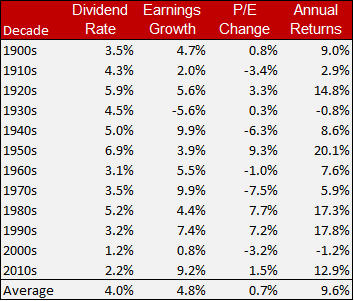
I want to direct your attention to a couple of things this table reveals. First, of the three main drivers of returns, dividends are the steadiest. The other two, earnings growth and P/E change, are far more variable from decade to decade.
Earnings growth is a function of the health of companies, which in turn is a function of the health of the economy. In a robust economy, earnings growth will be strong, and vice-versa.
The wild card in this analysis is the change in the P/E ratio. Think of it this way – how much are investors willing to pay for a stream of future payments? When investors are optimistic, they will pay as much as $25 dollars today, for every $1 dollar of future earnings. Does that sound insane to you? It does to me, but here’s why it’s true. The P/E ratio reflects investor sentiment, or how optimistic they are about the future. The stock market is driven by the emotion of investors as a group.
The problem is that there is no good way to estimate how this driver will change in the future. It’s pure guesswork. So, to make a reasonable guess about what the P/E will be 10 years down the road, I turn to my trusty old friend – mean reversion. Simply put, decades with very high P/E ratios are inevitably followed by decades with low ones. That’s mean reversion at work. I’ll have more to say about this when we drill down into the P/E numbers later on in this article.
Drilling down into each of the big 3 drivers
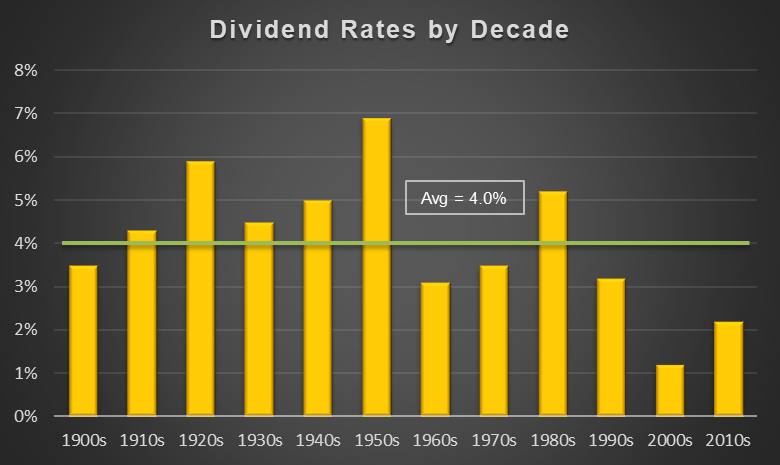
As I said earlier, of the three main drivers of returns, dividend rates have been the most stable over the decades. Yields peaked in the 1950’s and have been trending lower since then. The trend has been for companies to use retained earnings to buy back shares rather than increase their dividend payouts. Share buybacks are positive for reported earnings per share, but this is partially offset by the growing popularity of granting stock options to executives in lieu of cash bonuses.
In today’s fast-moving markets, with new technology coming to market at what seems like the speed of light, it’s easy to forget that dividends have accounted for a significant share of stock market gains over the long-term. New technology startups don’t pay dividends, which means that younger investors who are more comfortable in this brave new world aren’t generally concerned or interested in dividends as a source of wealth creation. What they look for is – and forgive the cliché – Unicorns. Explosive growth, game-changing technology, the next Facebook, or perhaps the holy grail of a completely free and independent blockchain-based internet.
Earnings growth has been relatively consistent, with some obvious outliers like the crash of 1929
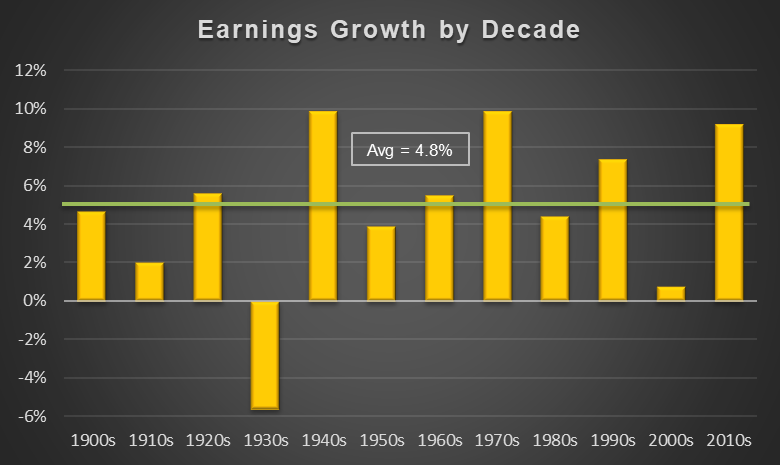
As you can see on the above chart, earnings growth rates have been more variable than dividend payout rates over the last 120 years. When push comes to shove, investors are paying for a future stream of dividends and earnings. And earnings are very difficult to forecast. The biggest earnings killer is the economic recession, where virtually all businesses report lower earnings.
Earnings growth is such an important driver of equity returns that they can’t be ignored. The best tool I have found to estimate future earnings growth is recession forecasting. I have devoted a large portion of my research to this effort, and I have found that it is quite possible to anticipate the onset of a recession and reduce equity exposure when the risk of recession is high.
Here is the real wild-card – P/E change
We now complete the circle by looking at P/E changes over the last 120 years. Most of you know what P/E means, so I won’t go into details about that. But what I want to focus on is why P/E changes so dramatically, from one decade to the next.
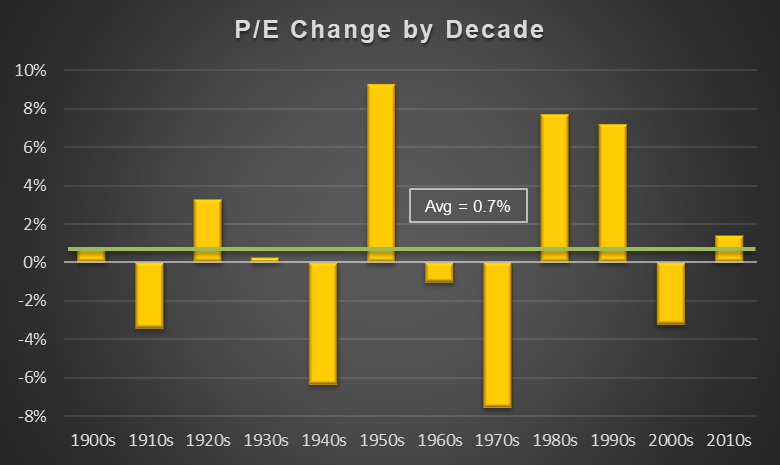
Note that the above chart shows that the long-term change in P/E is a very subdued 0.7%. But each decade looks like a different market entirely. Why is that? What I’ve found is that P/E is primarily a function of investor sentiment.
Investors who have the skill to make a reasonable estimate of earnings growth have solved two-thirds of the puzzle about future stock prices. The last piece is this: assuming your estimate of earnings growth going forward, how much are you willing to pay for each $1 dollar of earnings? The answer to this question is based almost entirely on sentiment. Are you optimistic about the future, or pessimistic?
In the 1970’s investors were extremely pessimistic about the future of the economy and the world in general. The bear market of 1973-1974 was one of the worst on record. Investors refused to pay up for future earnings because they did not believe that earnings were forthcoming.
So, the P/E ratio dropped by nearly 8% over the decade of the 1970’s. Investors fled the equity markets and prices eventually reached a level where stocks began to look like a bargain again. Just a cursory look at the P/E chart illustrates the extreme volatility of this driver of stock returns. It has always been thus, and it will always be thus, unless computer algorithms become so ubiquitous and precise that they remove the element of sentiment from the process of price discovery. It may come to pass one day, but don’t hold your breath.
What about the next 10 years?
John Bogle, a man I highly respect, says that the next 10 years, equities are likely to produce annual returns of 4-5%. I think he’s too optimistic. Other top minds in the business are calling for near-zero returns. I remember clearly when UBS, the Swiss bank and wealth manager, went on the record in early 2000 with a forecast that we were about to enter a “lost decade” in the equity market. This was a radical position for a wealth manager to take, given the fact that their revenues were tied to clients who were invested in the equity market. This really made an impact on me at the time.
As it turned out, UBS was correct. The decade of the 2000’s was not kind to equity investors. Two severe bear markets and a near-collapse of the global financial system pushed the average annual returns down to negative numbers. If you were lucky or smart enough to see what was coming, and went to cash, you were spared but you didn’t make much money. If you went into Treasury bonds, you were not only spared, you made a decent return of 5-6% depending on the maturity.
Mean Reversion
The basis of my assertion that equity market returns over the next 10 years will likely be in the low single digits, if not negative, is my belief in the irresistible force of mean reversion. Market history gives us clues about how mean reversion works. In the Roaring 20’s, optimism permeated the financial markets. World War I was over, and Americans had a shared sense that better days were ahead. The stock market was on fire, and stories about cab drivers and shoe-shine boys bragging about the killing they made in the market should have been a warning that things had gone too far. But nobody wants to be the first guest to leave the party, so the market kept climbing until the music stopped in October of 1929. The following two decades were a classic illustration of mean reversion at work.
The same scenario played out after the end of World War II. In the 1950’s the economy was booming and the stock market had one of its best decades ever. But mean reversion asserted itself, and the 1960’s saw market returns drop from 13.3% down to just 2.3%. The next decade was even worse. The 1970’s served up an average annual return of minus 6.2%. Ask yourself, are you willing to ignore an overvalued market with the belief that things will always work out eventually? It’s a quaint idea, and one that is heavily promoted by the investment industry as the only reasonable choice for most investors. Buy & Hold through thick and thin is the mantra of the adviser community. They say market timing doesn’t work. But think about the benefits to the investment adviser that accrue from this point of view.
Advisers, fund managers, wealth managers, and the like are compensated based on the size of their book. The more client assets they have under management, the higher their compensation. What happens when a client leaves the stock market and shelters in cash or Treasury bonds? The adviser takes a direct hit to his or her bottom line. So it’s in their best interest to keep clients fully invested at all times, so they can maximize their revenue per client.
This doesn’t make them bad people. It’s a flawed business model that’s to blame. The next time your adviser tells you to “stay the course” when things are falling apart, ask yourself if that’s really the best way to proceed.
This is important: I am not calling for a severe bear market in the next 6-12 months. In fact, it’s quite possible that the market will shake off the current doldrums and go on to make new highs. But I am less optimistic about the longer-term prospects for the economy and the stock market. I believe that we are once again headed into a lost decade, where average annual returns will be minuscule, if not outright negative. Why am I so pessimistic?
First, valuations. I have several models that take the measure of equity valuations, and they all reach the same conclusion – this market is stretched. But that alone is not enough to be pessimistic, because there have been many periods in market history where high valuations were followed by even higher valuations.
This time around, we have some major clouds forming above the economy and the stock market. Let’s start with the elephant in the room – the ballooning of the budget deficit. This is not an immediate threat, but at some point, our debt burden will begin to impact our economy. Then we have the enormous balance sheet at the Fed. They are working to reduce it, and the only way to do that is to raise interest rates. They have already stopped buying questionable credits left over from the mortgage crisis, and they are signaling that they will continue to raise rates until their balance sheet is restored to some semblance of normality.
In a rising interest rate environment, who benefits and who gets hurt? Banks benefit because they can charge more for their loans. But the Federal Government itself is the real loser here. Since 2008 the Treasury Department has enjoyed ultra-low interest rates on their borrowing needs. But it looks like those days are over. If the 10yr bond goes to 3.5%, which is likely, the Treasury will face a significant increase in their cost of doing business.
I won’t go into the geopolitical risks we face, because that would require speculation about an unknown future. But I will say that this type of risk is higher today than it has been in many years. Enough said.
What’s an investor to do about all of this?
First, don’t panic. These things evolve slowly over time, so there’s no need to take immediate action. What’s called for is a well-thought-out contingency plan – one that is ready to go when the time is right. This plan should include several defensive steps to be taken thoughtfully and gradually as needed. I won’t go into the details of how to design a contingency plan because every investor has different objectives, time frames, and risk preferences. Suffice it to say that vigilance is called for and start thinking about what steps you can take to protect what you have built over the last 9 years.
Here are links to related articles you might like:
The article was published two days ago. Bogle’s comment was made on November 20, 2017. Here’s a link to it. https://www.cnbc.com/2017/11/20/jack-bogles-5-bold-investment-predictions-for-2018-and-beyond.html
On what date was this article posted? When you quote Jack Bogle as saying, “the next 10 years … are likely to produce annual returns of 4-5%,” he means 10 years starting on what date?