
Bear Market Risk Has Increased
Summary
- The talking heads are ramping up the fear-mongering.
- This article looks for clues in the actual numbers.
- No reason to panic, but pay attention.
Thirty years in the business has taught me to pay attention to the numbers, not the headlines. Headlines are designed to grab attention, and fear sells better than anything other than sex. With that in mind, I have a few observations to share.
Observations
First, this has been a brutal week in the market and there’s no point in trying to sugar-coat that fact. But how brutal was it in historical terms? The answer is VERY brutal, especially in light of the calm and equanimity we’ve been enjoying for the last couple of years. It led to a sense of complacency, and the market has finally decided to wake us from our slumber with a nasty beat-down.
Second, fear sells. The stock market talking heads are trying to outdo each other with their end-of-the-world predictions. It’s mostly hyperbole, but it’s also grounded in some real concerns.
Third, the market is only down about 8%. That’s not even a big enough drop to qualify as a correction, which is 10%. It’s nerve-wracking, for sure, but I suggest that we all take a breath and survey the damage in a rational way. Then we can talk about where we go from here.
How bad was the last week?
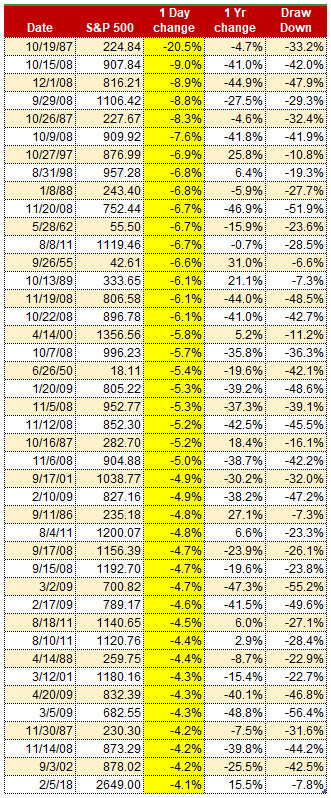
The short answer is… pretty bad. Of the 17,135 trading days since 1950, today (Monday, February 5) was #42 on the bad day list. It was worse than 99.8% of all days since 1950. That’s significant, wouldn’t you agree?
The chart below ranks all 42 big down days in order of magnitude. It also shows how the market was trending in the year leading up to the big decline. And it shows the total drawdown from the most recent high-water mark on the day of the big decline.
Where do we go from here?
To simplify the answer, I will lay out three possible outcomes (there are more than three, but these will suffice for now).
The first is that this selloff is the market correcting the extreme bullishness that has driven valuations to unsustainable highs. Well, that’s o.k. with me. We need to keep things in line with reality, such as earnings, economic growth, interest rates, inflation, and debt burdens. So, pullbacks like this are good for everyone. With the possible exception of day traders. In this scenario the correction is brief, and after a drawdown of 5-10%, the market gets back to business and makes more new highs.
The second scenario is a little more serious. Not fatal, just a little more painful. The damage done to investors who have never lived through a bear market, or have decided that the market can only go up, is worse than thought. These are the dip-buyers who have been supporting prices at every turn in the market. This downdraft may have shaken their confidence to the point where they are reluctant to buy a dip that’s as sharp as this one. The correction could extend for months, and cause a 15% decline (or worse) before it’s over. But it will end eventually, and the market will go on to make more new highs. Or at least it will come close to making a new high.
The third scenario is the beast who shall remain nameless. This scenario is characterized by a regime change among investors. The dip-buyers who have been dominating the market since 2009 slowly lose influence to the rally-sellers who have been held at bay up to this point. The market is an emotional enterprise. When the predominant sentiment shifts from bullish to bearish, there’s no telling how long or how far prices will fall.
The brutal week we just had turns into a brutal month. Rallies are attempted but fall short of new highs as the rally-sellers flood the market with paper. Eventually the few remaining dip-buyers give up and leave the game, at least temporarily. The 15% correction morphs into a 30% rout.
What are the probabilities of these three possible outcomes?
Here comes the math, but don’t worry because I’m going to keep it as simple as possible so that nobody gets lost in the weeds.
The probability of scenario #1 (a benign outcome with new highs fairly soon) is 62%, down from 68% one month ago. This is based on a Bayesian calculation of likely outcomes after key events such as the big decline we just experienced.
Scenario #2 (a deeper and longer correction that stops short of a new bear market) has a probability of 22%, up from 18% one month ago, based on the same Bayesian calculation.
Scenario #3 (a bear market that could even lead to an economic recession) has a probability of 16%, up from 14% one month ago. That number is cause for concern, but not for radical changes to your portfolio.
Final thoughts
I think most investors are a little concerned by the events of the last week, as they should be. If you’re worried, there’s nothing wrong with raising a little extra cash, say 10-15% or so. Even though the downdraft in the market feels serious, the odds still favor a recovery to new highs, rather than a direct line to the next bear market.
This could all change quickly, of course. Pay attention but don’t panic.