
Every four years, investors try to anticipate what the outcome of the presidential race will mean for the stock market and their portfolios. This topic is contentious and infused with partisan bias. I’ll provide some useful context for those heated discussions, for your investment plans, or for casual cocktail party fodder. The question at hand is, what a Trump presidency might mean for the stock market.
(Full disclosure: I am not a fan of Trump, but not based on partisan bias. I am fiercely independent. (I voted for Reagan twice.) I was careful not to let my opinion of Trump influence this article. I kept to the facts, and my methodology is transparent as you will see.)
The conclusions reached by others who have researched this topic are often contradictory, as you can see in the examples below:
“Presidential election years generally have coincided with favorable markets, particularly when the incumbent party wins.” – T. Rowe Price.
“Over the past century, which party occupies the White House has had no discernible or consistent impact on US equity markets.” – BlackRock.
“[The authors of the 2003 Journal of Finance article] found 9% higher stock market gains for large stocks in Democratic administrations since 1928.” –
“Most of the studies show quite an advantage for equities following the election of Democrats, but a Federal Reserve study concludes there is no consistent relationship if you correct for market volatility and test back to 1852.” – Pete Davis, CapitalGainsandGames
Jeremy Grantham’s study
Before I present my own findings, let’s first review the most-widely cited research on presidential cycles and market performance, which is the work of Jeremy Grantham.
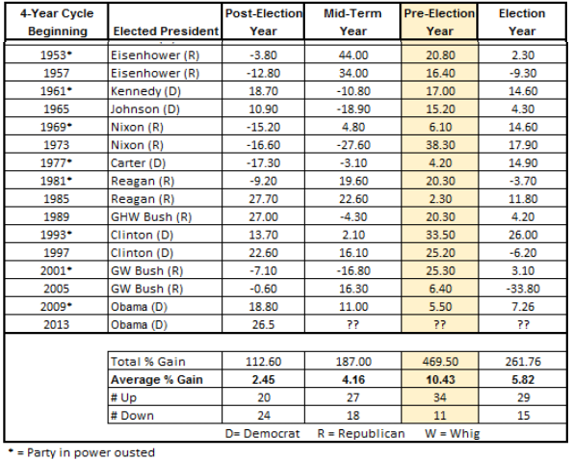
Based on observations of presidential election cycles made by Grantham, co-founder and chief investment strategist of Boston-based Grantham Mayo van Otterloo (GMO), pre-election years (the third year of the four-year term) have historically been good for equity investors, especially over the past century.
On average, the pre-election year has seen a 10.4% gain since 1833. So, generally speaking, the year before the presidential election and even the actual presidential election years are historically good for the stock market.
But my article asks a different question. Specifically, what has happened to stocks when there is a change in party leadership? Does is matter to investors which party is in power? In order to focus on the potential impact of a change in leadership, I limited my research to the first 12 months after a change in leadership took place. I wanted to find out how the market reacted to the initial burst of policy initiatives that every new president proposes, using the political capital that comes from wresting control of the levers of power from the opposing party.
![]()
Can a U.S. president impact the market in a meaningful way?
The sample size is too small and there are too many possible time frames one can choose for measuring the correlation between presidential elections and stock market returns. Rather than trying to make a case for causality based on questionable statistical methodology, I chose to look at past presidential elections and note what happened in the stock market.
I leave it up to the reader to draw his or her own conclusions about what, if anything, might be relevant to the upcoming change in tenants at 1600 Pennsylvania Avenue.
First, some ground rules. I limited my research to the “modern era” – from 1952 to present day. I did so because I wanted to avoid two world wars, the Great Depression and anything that pre-dated the establishment of the Federal Reserve. In other words, I wanted to limit my research to the election of presidents to whom I can relate. (I was in grade school when Eisenhower was elected, and I can remember seeing “I Like Ike!” banners, yard signs and buttons everywhere. I didn’t know what it all meant, but I could see that people were going crazy for the guy.)
Next, I only looked at elections where the occupant of the White House changed. I figured that if we re-elected a president for a second term, it meant that things were going well and I wasn’t interested in how the market reacted to it. But the rise of a new leader is a big deal, and I wanted to know what happened to the market when there was a changing of the guard.
I struggled with the time frame. I eventually settled on the period starting on Election Day in November, through the first 12 months of the new president’s term. That gave me a total of 14 months of market action to look at. Even though the new commander-in-chief doesn’t actually start the job until January 20th, the stock market is a forward-looking mechanism. So as far as the market is concerned, Election Day is the beginning of the new regime, notwithstanding the formality of the inauguration.
In order to draw attention to the period between Election Day and inauguration day, and to make each episode consistent, I drew the charts so that they all start at a base of 100 on inauguration day. That way we can see what happened between Election Day and the start of the term, and then we can compare market performance on an apples-to-apples basis for the first full year of the new president’s reign. The market performance comparison is from inauguration day on January 20th to January 20th of the following year – 12 full months.
Conventional wisdom suggests that Republican administrations, which are ideologically more business-friendly than Democratic administrations, would be more bullish for the stock market. But a review of the record since 1950 shows something different. History shows that the stock market does better, by a considerable margin, when the occupant in the White house changes from a Republican to a Democrat. Again, I’ll leave it up to the reader to determine why this is so.
Chart 1. Change in S&P 500 during the first 12 months of a new administration
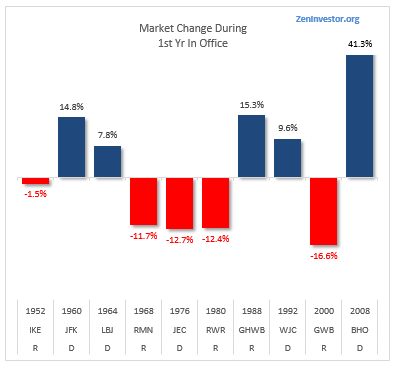
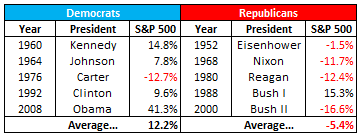
The market has averaged a gain of 12.2% during the first year of a Democratic administration. For Republicans, the market has produced a loss of 5.4% on average. That’s a stark contrast. Now let’s look at the numbers for each party separately.
Chart 2. Market performance during first year, by party
Investors do care which party occupies the White House. But this is a two-way street. The stock market has a good track record for predicting which party will win the election. If the stock market is up during the three months leading up to the election, the incumbent party has the advantage. Losses over those three months favor the challenger.
In the 22 presidential elections since 1928, 14 were preceded by gains and 8 by losses. In 12 of the 14 market-positive, pre-election run-ups, the incumbent (or the incumbent party) prevailed. And in seven of the eight market-negative run-ups, incumbents lost. This means there were only three exceptions out of 22 races: 1956, 1968 and 1980. Put another way, the S&P 500 has an 86% success rate in forecasting the election results. It will be valuable to see what happens in the market during August, September and October of this year.
Lastly, I’ll leave you with 10 individual charts showing the track of the market during the 14 months between Election Day and the end of the first full year of each new president’s term.
Charts 3 – 7. First year market performance for each new administration since 1950
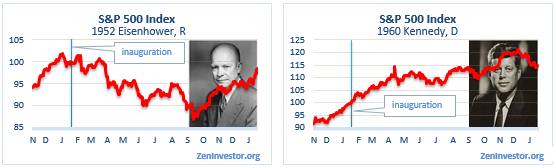
Eisenhower was elected in November 1952, and the stock market gave an enthusiastic thumbs up. Once he was sworn in, though, investors seemed to sober up and go into a funk. The market continued to decline until September 1953, and it was “happy days are here again” after that. Now compare this to the Kennedy election. Same post-election rally that Eisenhower enjoyed, but a very different start to Kennedy’s first year in office. Happy Days were there from the start, and enthusiasm only began to wane towards the end of his first year as president.
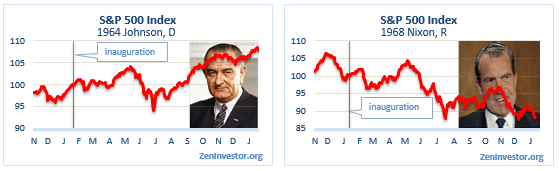
When Johnson was elected in 1964, investors seemed to be content with the way things were progressing in the economy. His first year was positive, with the exception of a mid-year decline that lasted barely 2 months. For Nixon, it was a stark contrast. From the time he was elected in November 1968, the market was struggling to find a reason – any reason – to go up. It was a year that most of us, including Nixon himself, would like to forget.
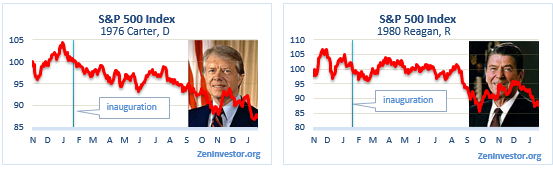
Jimmy Carter’s first year in office did not inspire stock market investors. In fact, it was the worst market performance for any Democrat in this study. After an initial rally right after the election, the market declined steadily, losing 12.7% during Carter’s first year in office. Then Ronald Reagan came to power, and ushered in a new era of hope and optimism. At least that’s what the pundits of the day said. But the market had a different idea, and handed Reagan a 12.4% decline in his first year. It didn’t help matters that he was elected during an economic recession, and then got hit with a second “double-dip” recession one year later.
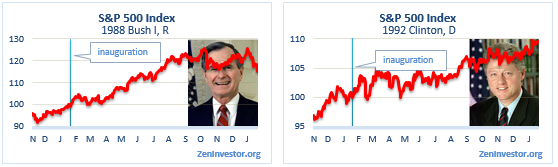
The first year of the presidency of George H. W. Bush was treated with kindness by stock market investors. It was the one and only winning first year performance of any Republican. Perhaps it was due to the belief among investors that Bush would continue the wildly successful “Morning in America” zeitgeist of the Reagan years. But the recession of ’90-’91 brought an early end to his chances to create a legacy like his former boss. Bill Clinton was swept into the Oval Office by convincing voters that “It’s the economy, stupid.” Judging by the stock market, he was right.
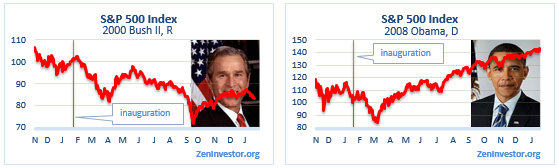
The arrival of George W. Bush coincided with one of the worst periods in American history, both geopolitically and economically. He arrived right after the dot.com stock market bubble had burst, Enron and other high-profile companies went bankrupt, and just a few months before 9/11. He also had to deal with a recession in his first year as president. The stock market didn’t have a chance. It handed Bush II the worst first year report card of any Republican in the study.
When Obama arrived eight years later, the economy was in free fall and the stock market was sinking along with it. His first few months saw big losses in share prices, but the market found a bottom in March 2009. Over the next 8 months of his first year, the market went up so dramatically that it gave him the biggest win of any president in this study.
Conclusions
What might a Trump presidency mean for the stock market? Nobody knows, because as I said earlier, the sample size is too small and the line of causality is fuzzy at best. But it’s interesting to look back in time and see how the market has reacted to changes in leadership. The difference in stock market performance between political parties is stark – too stark, in my opinion, to be brushed off as merely the luck of the draw. But this doesn’t mean that Republican administrations cause bad stock market performance.
It could simply mean, for example, that investors instinctively know that when a Republican replaces a Democrat in the White House, there is likely to be some belt-tightening. Republicans are the party of fiscal conservatism, after all. And when the belt tightens, there is a period of adjustment before the benefits from this policy begin to gain traction. This could explain why the market struggles in the first year of a Republican term.
The risk that comes with a potential Trump presidency is that it’s not at all clear what he will do when it comes to fiscal policy. Will he tighten the belt, or will he spend like a drunker sailor on things like building the wall on our southern border? It’s very hard to guess what he will do if elected, and if there’s one thing the stock market can’t abide, it’s uncertainty.