
Weekly Market Scorecard – March 10, 2017
- The S&P 500 is up 19% from a year ago.
- It’s up 10.9% since the election.
- Investors are mostly on board with Trump’s pro-growth agenda.
- This puts them in a buying mood, but they don’t have high expectations.
- Is the market too frothy?
- What is the “smart money” doing?
Let’s review the market internals for the two weeks just passed.
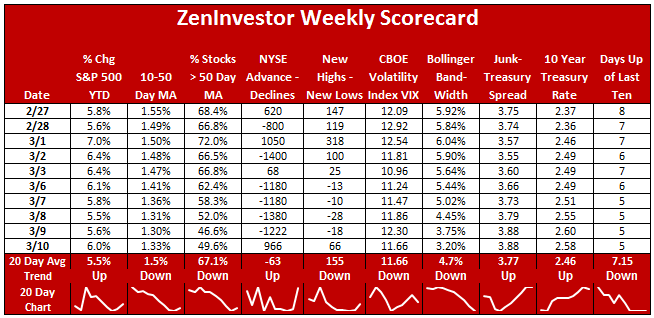
The table above keeps track of the level and trend of ten measures of market health. These are often called “market internals” because they reveal what’s going on below the surface of the market.
Of the ten indicators, four are trending higher and six lower.
The headline number, as represented by the year-to-date percent change of the S&P 500 index, is a very healthy 6%, and rising. But short-term momentum, as measured by the gap between the 10 day moving average and the 50 day, is falling. This tells me that traders with shorter time frames are starting to pull back just a little.
Our three measures of market breadth – the percent of stocks trading above their 50 day moving average, advancing stocks minus declining stocks, and new highs minus new lows – are showing weakness. Even though the S&P 500 and most other indexes are making new highs, there are fewer stocks participating in the rally. This trend can reverse quickly, but for now it’s worth keeping an eye on.
Volatility, as measured by the VIX and Bollinger Band readings, is declining. Investors are not worried about a big decline any time soon.
The spread between junk bond rates and Treasury bond rates is widening, mostly due to the uptick in the ten year Treasury bond rate.
Lastly, the number of up days out of the last ten trading days has slipped from 8 down to 5. That’s a neutral reading, but the trend is lower.
Plot of the year-over-year % change in the S&P 500 index
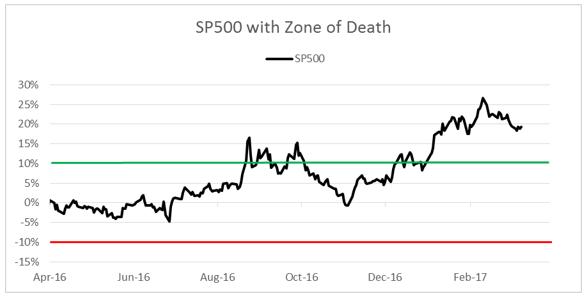
The black line on this chart tracks the difference between where the market is trading today, as compared to where it was trading last year at this time. The green line shows the boundary between a typical healthy market (one that is up at least 10% from the prior year) and a market that is struggling to stay healthy.
The red line shows the boundary between a market that’s struggling to remain healthy (one that is trading between up 10% and down 10%) and one that’s in trouble (below -10%).
The term “Zone of Death” describes the area of this chart between the green and red lines. When the market enters the ZOD, it tends to succumb to a kind of gravitational pull, where it moves quickly from one boundary to the other. The closer it gets to the center of the ZOD, namely the 0% line, the stronger the gravitational pull becomes.
Today the market is comfortably above the top of the ZOD, which indicates optimism, bullishness, and market health. When the market penetrates the green line from above, it’s time to pay closer attention. Conversely, when the market penetrates the red line from below, it’s an indication that things are improving and better days are ahead.
The Trump Rally
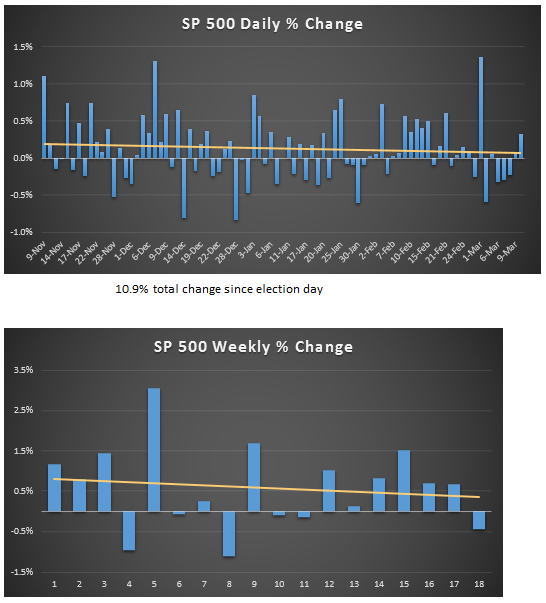
Since the election of Donald Trump, the market has rallied by almost 11%, but the pace of the increase is slowing. The yellow line on the above charts is a simple trend line, which shows a slight downward trajectory of both daily and weekly gains in the market since the election.
What is the “smart money” doing?
According to published flow-of-funds data and my sources on various trading desks, most of the buying that has taken place since the election of Donald Trump has come from retail investors, as opposed to institutional investors. So far, the retail crowd (often derided as the “dumb money”) is winning. The big institutions are more skeptical about the ability of Trump to get his agenda through congress. These investors are not participating in the Trump rally, and in fact, many are going short the market in anticipation of a showdown between Trump and congress, with congress having the last word.
Some takeaways
The bulls are clearly in charge. Investors don’t seem to care about all the drama that’s happening in Washington. They’re focused on the promised benefits of Trump’s pro-growth agenda. This bullish trend is likely to continue, until valuations become too stretched to support further market gains. Investors are showing signs of complacency, and expectations for a fast rebound in earnings might be just a tad too optimistic.
Trump has a golden opportunity to boost economic growth, bring back factory jobs, and renegotiate unfair trade deals. Investors hope, and expect, that he will deliver on these promises.