
Weekly Market Scorecard – March 24, 2017
- The post-election rally is still intact, but a little wobbly right now.
- The S&P 500 is up 9.6% since the election.
- Trump’s political capital has taken a hit.
- Investor optimism is starting to waver, but it may return.
- A correction of 10% or so would probably be a good thing.
The current health of the market
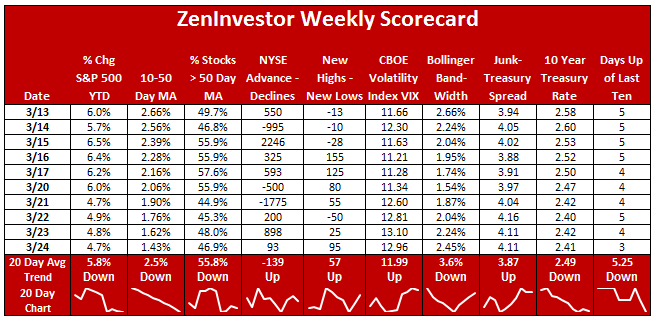
The table above keeps track of the level and trend of ten measures of market health. These are often called “market internals” because they reveal what’s going on below the surface of the market.
Of the ten indicators, four are trending higher and six lower. This is a clear deterioration from what we’ve seen since the election. There is no cause for concern at this point, because these are short-term indicators. They can reverse quickly, and they often do. The way I react to this is by keeping a closer eye on the weekly changes of these indicators. I try not to over-react.
The first indicator, the year-to-date percent change of the S&P 500 index, is a still healthy 4.7%, but it’s been falling steadily for the last two weeks. Short-term momentum, as measured by the gap between the 10 day moving average and the 50 day, is falling. This tells me that traders with shorter time frames are becoming more defensive.
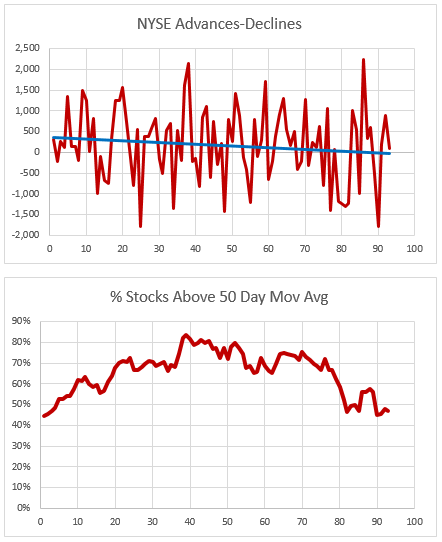
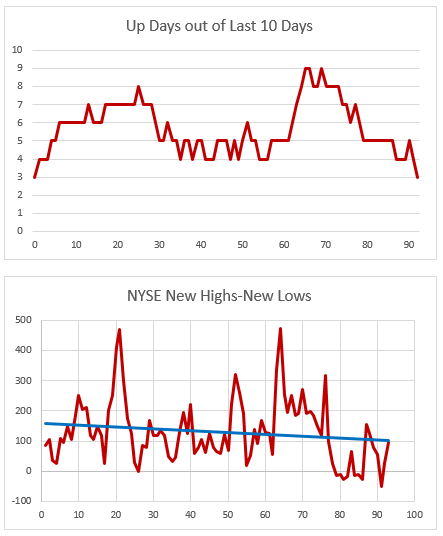
Our three measures of market breadth – the percent of stocks trading above their 50 day moving average, advancing stocks minus declining stocks, and new highs minus new lows – are still positive but becoming less positive over the last two weeks.
Volatility, as measured by the VIX and Bollinger Band readings, is mixed. The market is still very quiet relative to historical readings, but pressure seems to be building for a burst of activity. Investors are not worried about a big decline any time soon.
The spread between junk bond rates and Treasury bond rates is widening, which indicates a very slight uptick in concern on the part of bond buyers.
Lastly, the number of up days out of the last ten trading days has slipped to 3. That’s a negative reading, and the trend is lower.
Plot of the year-over-year % change in the S&P 500 index
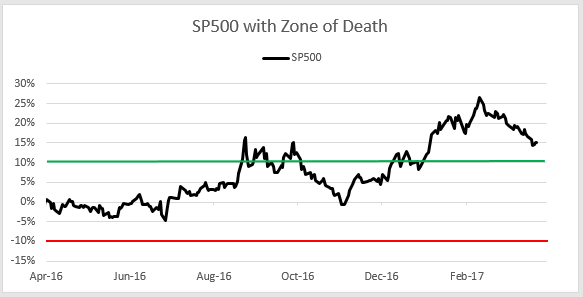
The black line on this chart tracks the difference between where the market is trading today, as compared to where it was trading last year at this time. The green line shows the boundary between a typical healthy market (one that is up at least 10% from the prior year) and a market that is struggling to stay healthy.
The red line shows the boundary between a market that’s struggling to remain healthy (one that is trading between up 10% and down 10%) and one that’s in trouble (below -10%).
The term “Zone of Death” describes the area of this chart between the green and red lines. When the market enters the ZOD, it tends to succumb to a kind of gravitational pull, where it moves quickly from one boundary to the other. The closer it gets to the center of the ZOD, namely the 0% line, the stronger the gravitational pull becomes.
Today the market is still above the top of the ZOD, which indicates optimism and bullishness. When the market penetrates the green line from above, it’s time to pay closer attention. Conversely, when the market penetrates the red line from below, it’s an indication that things are improving and better days are ahead.
The Trump Rally
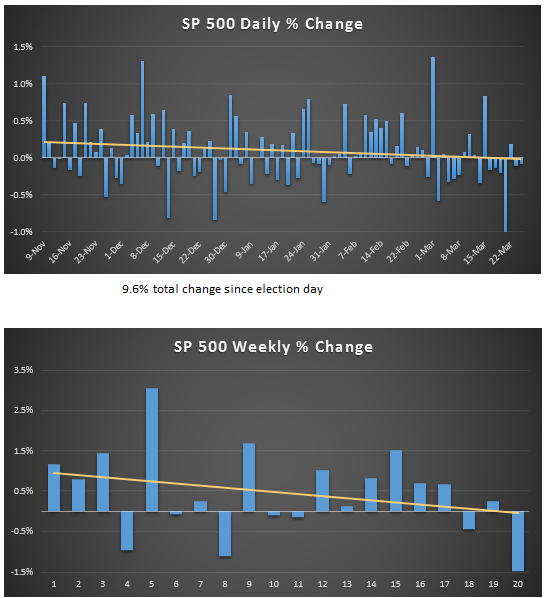
Since the election of Donald Trump, the market has been in rally mode, but the pace of the rally is slowing. The yellow line on the above charts is a simple trend line, which shows a clear downward trajectory of both daily and weekly gains in the market since the election.
Some takeaways
The bulls are still in charge. Investors don’t seem to care about all the drama that’s happening in Washington. They’re focused on the promised benefits of Trump’s pro-growth agenda. This bullish trend is likely to continue, until valuations become too stretched to support further market gains.
Investors are showing signs of concern that their expectations for a fast rebound in earnings might be just a tad too optimistic.
Trump has a golden opportunity to boost economic growth, bring back factory jobs, and renegotiate unfair trade deals. Investors hope and expect that he will deliver on these promises.
Smart Money update
According to my sources on various trading desks, most of the buying that has taken place since the election of Donald Trump has come from retail investors, as opposed to institutional investors. So far, the retail crowd (often derided as the “dumb money”) is winning. The big players were forced to go along with the retail buying in order to protect their bonuses. But over the last two weeks, these large investors are telling me that they have slowed down, or stopped completely, initiating new long positions.
It’s important to note that nobody I’ve spoken with has indicated that they are net sellers of stocks. It’s too early to bet against the market.