

The Zen Ten Letter
Every December I publish a list of stocks that I believe will outperform the market over the next year. I don't change the list unless a company gets acquired or delisted.
The top performer on this list is EPAM Systems, up 96% YTD. EPAM is a Pennsylvania-based global software firm. In second place is CBRE Group, up 70%. CBRE is a Dallas-based commercial real estate company. Microsoft is in third place.
In case you missed it, here is the original article. It includes a description of the methodology I use to select these names. It also shows the results for the prior year's picks. Below is the YTD Zen Ten performance for 2021.
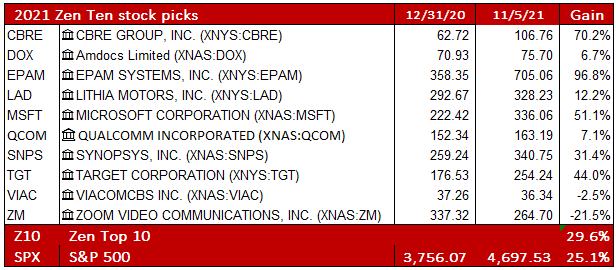
Being locked in for a full year can sometimes be painful when a good company has a temporary stumble and its share price tumbles, as was the case this year with Zoom [ZM]. On February 4 this year, Zoom traded at $433 per share. Today it's changing hands for less than $265 per share. What happened?
As people began to return to work, Zoom video calls became less of a necessity. I think ZM will recover eventually, but it may take a long time for it to get back to $433.
2021 YTD performance of our top-performing model portfolios
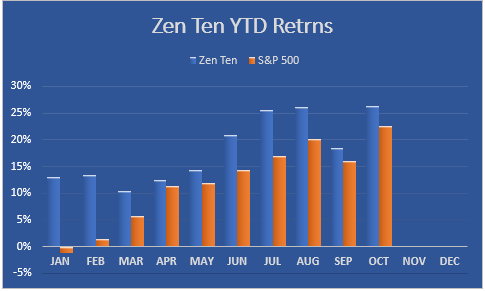
Zen Ten
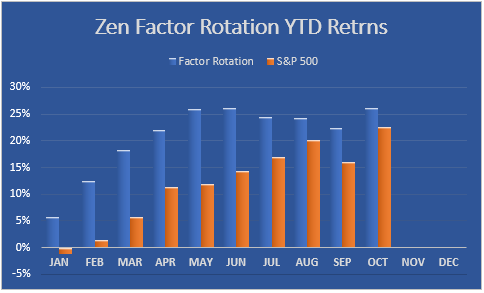
This chart, and those that follow, show the month-by-month returns of each portfolio on a cumulative YTD basis. As of 11-5-21, Zen Ten is up 29% YTD.
Earnings Leverage
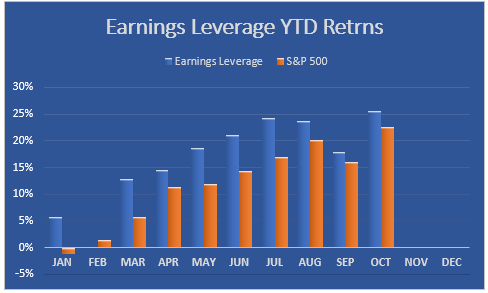
This strategy focuses on companies with fast-growing revenues and earnings, rising analysts earnings estimates, and at least one rating upgrade in the previous 30 days.
Sector Rotation
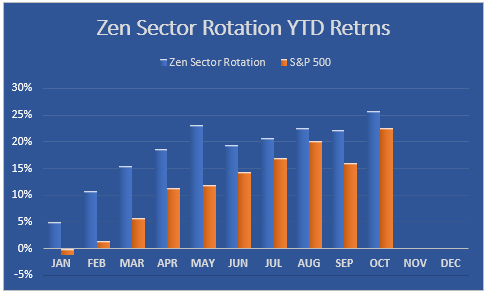
This strategy looks at all eleven market sectors and buys the top 3 sector ETFs based on price momentum over the past 1-month, 3-months and YTD time frames. It also considers where we are in the business cycle, since certain sectors tend to do better or worse on that basis.
Factor Rotation
This strategy looks at 10 factors that have historically influenced price performance. Examples include Value, Size, and Beta. It ranks these factors and buys the top 3 factor ETFs that represent them.
The 10 year performance of all our model portfolios

Over the last ten years, all 13 of our model portfolios are ahead of the S&P 500. These are real portfolios, with real client money invested. There is no backtesting involved here. I also invest in them so I have skin in the game too.
Stay tuned for further updates as the year unfolds. I won't publish updates every week, but I will let you know when something meaningful happens in the market, or in these ten stocks.
(Note: all of these portfolio models are available by subscription with the exception of the Zen Ten which is free to all.)