

The stock market has shown impressive strength lately, and I’ve been getting lots of inquiries from clients and subscribers about how they can buy a little insurance against the prospect of a retest of the recent lows.
Those who follow me know that I prefer to stay fully invested unless it becomes clear that a recession is looming in the near future. Recessions are the only time when I recommend exiting the market completely. All other downdrafts in the market are best handled by playing defense in a less aggressive way. Non-recession declines are shorter, shallower, and less stressful than recession-linked declines.
So back in 2005 I created a model portfolio that my clients could use as a temporary hedge against these periodic downturns. I called it the ZI 10 Best Shorts model portfolio. It has been very successful in doing what I designed it to do – provide a hedge while maintaining full exposure to the market.
The Best 10 Shorts portfolio is a simple screen of the universe of investable stocks. This screen looks for companies that are vulnerable, both technically and fundamentally. It looks at things like valuation, earnings trends, analyst opinions, price momentum, and balance sheet quality.
When an investor feels strongly that the broad market is vulnerable, she has the option of allocating 10% or 20% of her portfolio to this hedging vehicle, while remaining invested with the balance. Here are the details of how this portfolio works.
- The model is designed to be used for hedging long exposure during weak markets.
- It periodically holds up to 10 short positions in vulnerable stocks.
- The model has been live since 2005. Additional backtested results are available by request.
- In a weak market, the model performs best for obvious reasons.
- In a sideways trending market, the model will still outperform.
- In a strong market, the model underperforms, but it does not generate large losses.
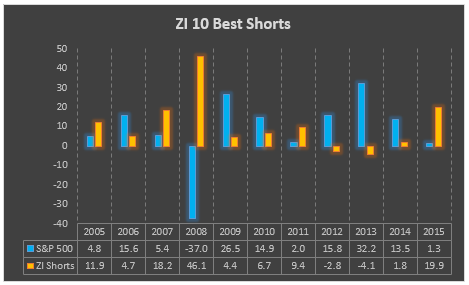
Over the past 11 years, the model has added 277 basis points of alpha per year, on average, to a traditional buy and hold strategy, assuming a 10% allocation.
For a stock to be included in the model, the following parameters must be met:
- Price > $5.00.
- Average daily volume > 100,000.
- Next year’s projected P/E Ratio > 50.
- Technical score of C or lower. (Momentum, relative strength, on-balance volume, etc.)
- Fundamental score of C or lower. (Balance sheet, earnings growth, analyst downgrades, etc.)
- Technical & fundamental scores in decline over the last 12 weeks.
The chart below shows the actual performance of this model since its inception in 2005.
Let me re-emphasize that this portfolio is for hedging purposes only. It is not designed to be a stand-alone portfolio.
As you can see from the chart, when the market is strong this portfolio loses money, although not very much. The best way to use this portfolio is by selectively allocating 10% to 20% of your available funds, and only when you are highly confident that the market will be weak in the near future. There are trading costs to consider when implementing this strategy, so it should not be taken lightly.
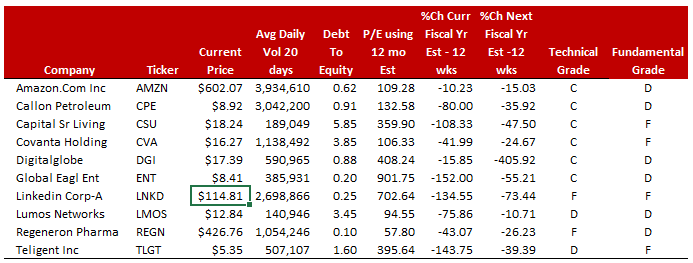
Here is the most recent version of the ZI 10 Best Shorts portfolio, as of April 5, 2016.
If you have any questions about the methodology, timing, or execution of this hedging strategy, send an inquiry to info@zeninvestor.org and I will answer you as soon as I can.