

Support, in the stock market, is a well-understood but often misused term. At its core it's defined as the most recent price from which the market has rallied.
Analysts who are of the technical persuasion place great weight on the significance of support prices. This article will shed some light on the subject.
Technical Support Bias
The first thing you should do is throw out all of the support levels that the market punditry proffers. These pundits can't even agree on what to order for lunch, let alone actual support prices. They have a built-in bias that tells them where the support level is, regardless of what may be happening on a macro level. This is the Achilles Heel of Technical Analysis.
I'll make things easy for you. And remember, I have no incentive to defend my market position. I am constantly adapting my equity exposure to fit the current state of the market and the economy.
The Basics
We only have to define two things: support and breach of support. Forget what you've been told about support because my definition is easy to understand and valuable for investors who care about protecting their capital.
Support is the most recent and lowest closing price, followed by a higher price. Maybe that's a little confusing, so let me illustrate how it works.
How it Works
Below is a table of the most recent supports and their breaches from 4/30/19 to 6/3/19.
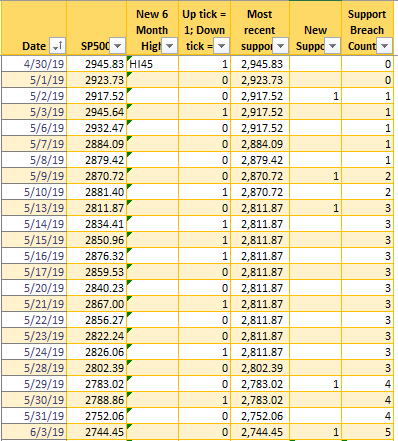
Let's walk through the above table.
On 4/30/19 the market made an all-time high of 2945 on the S&P 500. All closing prices since 4/30/19 are below this level. This establishes 2945 as the top for this analysis. When the market eventually closes at a higher price, the Breach Count will be reset to zero..
You will notice that after 4/30/19 there have been a series of lower lows and lower highs in the market. Each time the market makes a new low, it becomes eligible for designation as a new support price. But it takes more than that.
If the market closes lower the next day, that new price is now eligible for support and replaces the prior day's close. This continues until there is an uptick in the closing price of the market. When that happens, a new support price is established.
Do you see what's going on here? A new support price can only be identified if there is a subsequent uptick in the market. This is a key piece of information.
How does the Breach Count help us?
The Breach Count is very informative but it can't tell us what to do tomorrow. This is one of several indicators I use in my Bear Market Probability Model. When the Breach Count gets to 7 or higher it means that market technicals are in a state of deterioration. Today it's at 6.
Now that you know how this indicator is calculated, you can use it however you want. If you want more information about the track record of this indicator, email me through the website.
Be careful out there.