
 The Zen Value Factor Trading Strategy looks for companies that are trading at a discount to their fair value, and below the median valuation for their industry group. From this subset of companies, it then looks for those that have a catalyst that could generate more interest from buyers.
The Screening Algorithm
This factor trading strategy begins with a universe of 6,000 stocks of all sizes, industries, and geographical locations, the algorithm selects the most under-valued, based on fundamental measures like price-to-book value, price-to-free cash flow, price-to-sales, P/E ratio, etc. But it doesn’t stop there.
It then applies a second filter that only allows companies that have positive earnings revisions or have recently been upgraded by one or more analysts. We run the screening algorithm every four weeks, and it produces a list of 10-15 candidates for further consideration.
We then look at each candidate and eliminate any that have “snuck through the net” by virtue of bogus numbers, lack of trading volume, or rumors of accounting irregularities or solvency risk. The final list of stocks that make it into the model portfolio consists of 5-7 thoroughly vetted names. These finalists tend to be smaller than average in size, and younger than average in age. But there are also names that are blue chip companies that have temporarily fallen out of favor, and might be poised for a rebound.
The Performance History
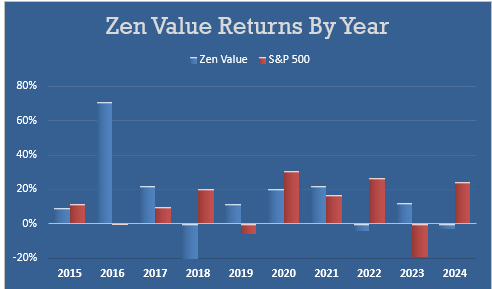
The performance of the Zen Value Factor Trading Strategy has been mixed, due to the dominance of the Mag 7 stocks, which are growth names. This illustrates an important feature of this strategy: There will always be periods when it under-performs the market. It’s an inevitable fact of life, unless you were a client of Bernie Madoff, and never experienced a down year until you lost everything.
Zen Value Track Record
$55/month
$550/year
Hi Marc,
I benchmark all of my strategies against three indexes. S&P 500, Russell 2000, and Russell 1000 Equal Weight.
For consistency in computing performance, I use the S&P 500.
The algorithm produces 5-7 names every 4 weeks. The average turnover for Top 7 is 74 trades per year.
Erik
Erik
Always enjoy your SA articles and am intrigued by your new strategy. Just a simple question on the Zen strategy though. What is the benchmark or “market” that you are using? Are prior holdings available to see how much trading/turnover is involved in the portfolio?
Thanks
Marc