
Stock market outlook
The bull market in US stocks appears to be intact. We expect corporate earnings to turn positive as economic growth slowly improves and the twin headwinds of energy sector losses and the strong dollar continue to recede into the background. But we also think that market gains will be constrained by already-high valuations. In the short term, it looks like the correction has run its course.
Market risks from junk bond defaults or aggressive rate hikes by the Fed have lessened recently. As a result, we are raising our one year S&P 500 target from 2080 to 2150.
May 2016 Highlights
Through The Looking Glass
Negative rates in Europe mean that some people are receiving mortgage interest payments from their banks. In Switzerland, some residents are being asked not to make monthly tax payments. And in Japan, sales of home safes have increased as savers look to avoid paying interest on their bank deposits. Some day we’ll probably look back at this and say… well, that was weird. What were they thinking?
As The World According To ZIRP moves forward, negative interest-rate policies are both a danger and an opportunity for nimble investors. In the short-term, savers are subsidizing economic stimulus. Long-term, markets are adjusting to an increasing likelihood that rates will remain low or negative for months or years to come.
The Economy
Global economic growth may be punk, but at least it’s staying positive, driven by the ongoing economic expansion in the US and the gradual growth improvement in Europe. It wasn’t very long ago that China was the driver of global growth. Today China is struggling just to remain above stall speed. The weakness in the global manufacturing sector seems to have found a bottom, at least for now. And major headwinds to US growth in 2015 and early 2016 – specifically, the strength of the US dollar, low energy prices, and high corporate credit spreads – are fading.
European economic data are pointing toward a mild recovery in growth trends. Even emerging markets are showing signs of stabilization in economic data. Fears of a sharp devaluation of the Chinese yuan and a potential economic “hard landing” have given way to mild optimism, as new data is released. We look for China’s growth to stay sluggish, but it will probably stay above stall speed of 6% or so. Meanwhile, most central banks are committed to maintaining supportive monetary policies.
Equities
Global stock prices have recovered most of their losses from earlier in the year. US and emerging market stocks have even turned positive year-to-date. We have a small overweight in US equities. US corporate earnings are expected to return to a positive growth rate for the remainder of this year. Earnings results for the first quarter are negative, but have on average exceeded analysts’ sharply reduced expectations. We are seeing a stabilization in emerging market economic data, and some relief from falling commodity prices. While corporate earnings are still weaj, investor sentiment toward EM assets has clearly turned positive lately.
Fixed income
We maintain our preference for US investment grade corporate bonds over their European or EM counterparts. Their higher yield should help them outperform government bonds. We are neutral on US high yield bonds as prices have risen to slightly expensive levels. We expect to see more defaults in the junk bond market over the next 12 months. We have also become less enthusiastic about municipal bonds, but we are not ready to lighten up on our allocations just yet.
Our Forecast for the U.S. Economy
Moderate expansion – Probability: 65%
We expect the US to grow at a sub-par 1.8% rate over the next 12 months. The labor market is healthy and improving, with solid job growth and even some early signs of faster wage growth. Rising household income and low energy prices should spur an uptick in consumer spending. Housing starts and home prices should remain healthy, contributing modestly to overall economic growth. Rebounding oil prices will help to spur renewed energy sector fixed investment. This will improve the outlook for growth, particularly in the manufacturing sector.
Strong expansion – Probability: 15%
In this scenario, US real GDP growth takes off, hitting 2.5% or more, propelled by an aggressively friendly monetary policy, strong household spending, and lower risks from overseas economies. This causes the Fed to raise policy rates faster than markets anticipate. Stock markets sell off initially, but recover when growth becomes evident.
Growth recession – Probability: 15%
In this scenario, US growth stumbles. The 0.5% GDP reading for the first quarter gets repeated in the second and third quarters. Earnings continue to disappoint. Consumers save rather than spend the windfall from lower gasoline prices, while businesses drag their feet with hiring workers and spending on expansion plans. The Fed stays on hold throughout 2016.
Outright recession – Probability: 5%
Our indicators, both leading and coincident, point to continued growth in the U.S. The only thing that could cause us to change our view would be a major terrorist attack or a Trump presidency.
Commodities
Based on recent price action, it appears that the long bear market in commodities has finally come to an end. Is this just another head fake? Will the rebound in prices turn out to be just a dead-cat bounce? We’ve been down this road many times before, and skepticism abounds. But one thing is clear – those who piled into the crowded short trade late in the game are now licking their wounds. We estimate that about half of the short position has been covered, leaving more room for further price gains.
Crude oil
Brent crude has risen to a five-month high. Much of the move is the result of short covering in a crowded trade. Add to the mix some pockets of production outages and improving market sentiment, and you get a recipe for a classic oversold rally. But the fundamentals have not improved enough to justify the move. The oil supply glut remains, and inventories should continue to build. Supply cuts will eventually start to balance out the oversupply, but we don’t expect to see that before the second half of this year.
Precious metals
Gold has been range-bound between 1200 and 1250 for most of March and April. Gross speculative long positions are at their highest levels in five years, and around half of last year’s institutional short positions have been covered. ETF buying of gold and gold miners has also been increasing. Our guess is that the move higher in gold has been largely due to two factors. First, there is a clear uptick in inflation expectations in the capital markets. And second, the dramatic rise in the dollar has sputtered lately. Both of these trends can reverse on a dime. As a result, we remain skeptical about the continuation of the gold rally.
Agriculture
The recent uptick in grain prices is another matter. It has the potential to be more sticky than the run-up in gold. The macro forces at work are bigger and more durable than inflation expectations or the latest zigs and zags in the dollar. Climate change, water shortages, population growth, urban sprawl – all represent seemingly unstoppable macro trends that will contribute to the scarcity and demand for the raw materials of our global food supply. Accordingly, two of the core holdings in our model portfolios are the PowerShares DB Agriculture ETF (DBA), and PowerShares Water Resources ETF (PHO).
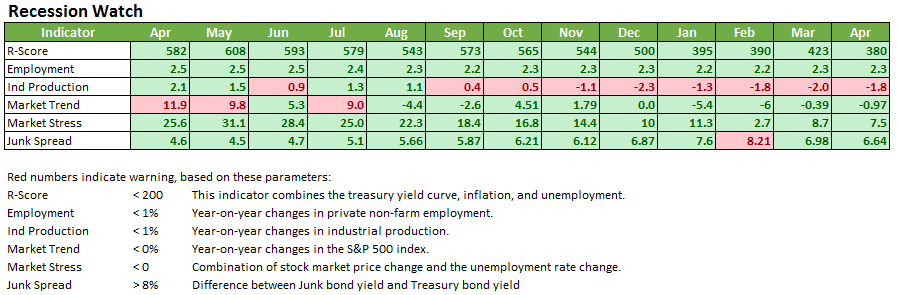
Key Recession Indicators
As we stated earlier, our indicators show that the risk of the US economy sliding into recession this year is low – less than 5%. We base this assertion on a combination of factors that have proven accurate in calling every turn in the business cycle since 1957, with no false signals. Unlike other econometric models, ours is not proprietary. It’s open to anyone who asks to see it. The input data is readily available and can be found on the internet with a few clicks of the mouse. If you would like to replicate our model, send a request to info@zeninvestor.org with the subject line “recession model.”
Our 12 Month Forecast of Asset Prices
Tactical asset allocation
Our current view is that, while negative rates may seem a little weird, they demonstrate the willingness of central banks to do “whatever it takes” to support global economic growth. We think that this topsy-turvy policy will continue to provide support for risky assets like stocks, and that it will probably continue for longer than most investors imagine.
We are keeping our slightly overweight position in US equities. We expect US profits to improve after the current earnings season, as the oil price recovery, dollar weakness, and ongoing strength in employment begin to manifest as rising corporate earnings.
We also keep our overweight allocation to US investment grade corporate bonds. Low interest rates will continue to drive a demand for yield wherever it can be found, and the low probability of a US recession make this a risk worth taking for diversified investors.
The above allocation is for tax-deferred accounts with an investment horizon of 20 or more years. For details about our models covering taxable accounts, or accounts with shorter time frames, send a request to us at info@zeninvestor.org with the subject line “asset allocations.”