
This is the second installment of a three-part series about how to avoid bear markets.
An Alternative to the popular Buy & Hold approach
- A systematic, rules-based risk management methodology
- Designed to reduce equity exposure during weak markets
- Increases risk-adjusted returns by reducing portfolio volatility
- Tested and proven effective since 1900
- Has added 2.3% per year in absolute returns, vs. buy & hold
- Has reduced portfolio volatility from 16.2% to 11.6% per year
- Has reduced maximum drawdowns from -32.9% to -17.8%
Introduction
In my previous article on this topic, I argued that buy & hold might be the best strategy for many investors, but not for all investors. Like all strategies, buy & hold comes with a cost. If you are willing to bear this cost, then it might be suitable for you. But in order to make an informed decision about which strategy is best for you, it’s important to know what the facts are. Wouldn’t you agree?
With that in mind, I’m going to go over the details one alternative to the widely promoted buy & hold strategy. It’s a systematic, rules-based system that uses moving averages to inform the asset allocation mix of your portfolio. The numbers I’m using today are based on an “all-in” or “all-out” scenario. In other words, you are either 100% invested in stocks, or 100% invested in Treasury bills. I have clients who use this approach, and clients who use a more nuanced approach where they reduce their equity exposure in stages, depending on the severity of the market decline.
This alternative to buy & hold also comes with a cost. It requires a more “hands-on” approach to managing your investments. A buy & hold investor can maintain her portfolio by reviewing and adjusting the asset mix once per year. Simple, easy, and quick. That’s the appeal of buy & hold.
A proactive investor, by comparison, may have to review and adjust things two, three, or even four times per year. The more often you trade, the higher your trading costs. This additional demand on your time and attention is the primary cost of using a proactive approach to managing risk. In exchange for bearing this cost, your reward is getting out of harm’s way when harm is clearly on the horizon.
The Hidden Cost of Buy & Hold
Richard Thaler, newly minted Nobel Laureate in Economics, posits that Rip Van Winkle would have been a very successful investor. If he had invested all his money, and then took his nap, he would awaken 20 years later to find that his money had grown substantially. But there’s a flaw in this argument. Thaler has not factored in the deleterious effects of inflation.
Let’s suppose that Mr. Van Winkle took his famous nap in April of 1980. When he woke up in 2000 he would have been very happy indeed, because his account would have grown by 28.5% per year for each of the 20 years he was asleep. He awoke with 500% more buying power than he had when he went to sleep.
But what if, instead, he took his nap in March of 1962? He would still have all the advantages of a buy & hold approach, but the outcome would be dramatically different. Instead of earning 28.5% per year, he would have lost -2.49% per year. And his buying power would have been cut in half.
The point is that in investing, risk matters. Buy & hold investors tacitly ignore the risk component, and instead make the following calculation: “I’m not skilled enough to know when the market is too high or too low, so I’ll just ride the waves and assume that over a long enough time frame I’ll be o.k.”
That attitude may be right for many investors, but I argue that it’s not for every investor.
The Dogma of Buy & Hold
Why does buy & hold enjoy such widespread praise from the investment community? I think there are two reasons. First, it offers the benefit of simplicity, and therefore, low-maintenance. Most investors lead busy lives, and the thought of spending precious free time on investment related activity is about as attractive as doing your taxes.
Second, the investment community benefits financially from the buy & hold strategy. This wasn’t always the case. For the first 200 years of the stock market, we operated under “fixed commissions.” What that meant was that brokers charged their clients a predetermined, or fixed, commission that the industry agreed upon.
Under this compensation model, brokers were incentivized to encourage clients to trade as much as possible. There were no annual fees in those days. Brokers earned their living from trading activity.
Then, on May 1st, 1975, the era of fixed commissions ended. From that day forward, commissions could be negotiated. Needless to say, commissions went down dramatically.
When discount brokers arrived on the scene, the compensation model began to shift from commissions to annual fees. These fees were, and still are, based on the amount of money in the investor’s account. It no longer mattered how frequently you traded. The broker, or advisor in today’s parlance, made the same amount of money off of you, whether you did one trade per year, or 1,000.
It didn’t take long for brokers to figure out that it no longer paid to encourage active trading. The more trading you do, the more time your advisor must spend on your account. And he is not compensated for that time. The best clients are those who open an account, deposit their funds, and never bother the advisor again. Buy & Hold, baby.
There must be a better way
Regardless of what you may have been told by finance experts, there are ways to know – with a high degree of certainty – when the market is healthy and strong, and when it’s weak and getting even weaker.
The approach I’m about to show you is very effective at getting you out of harm’s way when a big downturn in the market is in progress. As I will demonstrate, being out of the market during the worst periods will not only reduce your risk, it will also increase your returns by a non-trivial amount.
It makes sense to have a contingency plan in place for dealing with the inevitable dark times in the market. Are you prepared for the possibility that one of these financial storms may come along and wipe out 50% or more of your invested wealth? A storm like that isn’t just possible; it’s likely to happen about every 12 years on average. And it will take 10-15 years for you to fully recover.
Investing in the 21st Century
On December 31, 1999, the biggest threat we faced was Y2K. Although nothing came of it, the stock market was about to experience a major drubbing. It was perhaps ironic that the market meltdown was especially hard on technology stocks.
Today the stock market seems to be stuck in a repeating pattern. Eight years after the technology bubble burst, it was the housing and mortgage bubble that nearly took down the entire global financial system. Each of these episodes ended with painful losses of 50% or more. It looks even worse when we look at these events in terms of the loss of purchasing power and the amount of time lost while rebuilding it.
US stocks have returned a stingy 5.36% per year, including dividends, from 2000 – 2016. When we factor in inflation, the real annual total return drops to 2.24% per year. This is what you get with Buy & Hold. Is that acceptable to you?
One of the reasons for the subpar returns is that valuations started the 2000s at extreme levels. The ten-year cyclically adjusted price-to-earnings ratio (CAPE) reached a level of 45 in December 1999, the highest level ever recorded in the US.
Figure 1 – Asset Class Performance 2000-2016
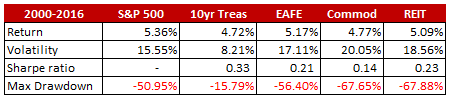
The last 17 years have not been kind to equity investors. Even when we include the historic bull market that began in 2009, we still end up with an average return of 5.36% for the period. What’s even worse is the fact that this raging bull has taken the market to heights not seen since 2000 (just before the bursting of the tech bubble), and 1929 (just before the market crash and great depression).
There are plenty of market pundits who say that this time is different. They argue that historically low interest rates and a flood of cheap money is justification for current market valuations. I’ve been around long enough to know that this is a dangerous assumption.
Tactical Asset Allocation
This moving-average strategy is designed to be simple to understand and implement. It involves a short list of specific trading rules and parameters. It requires action once or twice per year, on average.
Moving-average-based trading systems are the simplest and most popular trend-following systems. For those unfamiliar with moving averages, they are a way to dampen volatility. The example below shows the S&P 500 with a 10-month simple moving average (SMA).
Figure 2 – S&P 500 with 10-Month Simple Moving Average, 1995-2016
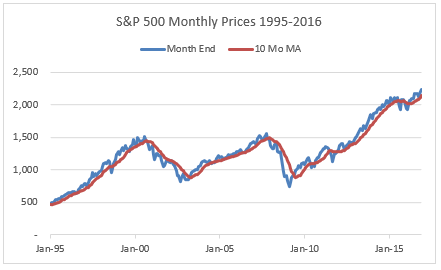
The most widely used moving average is the 10-month, or 200-day simple moving average. The concept is straightforward. Looking at the above chart, you would be invested in stocks when the blue line is above the red line. You would be invested in Treasury bills when the blue line was below the red line.
Professor Jeremy Siegel ran a simulation where he owned stocks when the market closed at least 1% above the 200-day moving average, and then switched to Treasury bills when it closed at least 1% below the 200-day moving average.
He found that this version of tactical asset allocation improves the risk-adjusted returns of a portfolio, compared to buying and holding stocks throughout the entire time period. When all transaction costs are included (taxes, bid-ask spreads, commissions), the risk-adjusted returns are still higher for the 10-month moving average strategy. Is this strategy a form of market timing? Yes, but it works because it’s essentially a risk management strategy.
Here’s how it works
- Be invested in stocks when the month-end index price is above the 10-month simple moving average price (SMA).
- Switch to Treasury bills when the month-end index price is below the 10-month SMA.
- All entry and exit prices are on the day of the signal. The model is only updated once a month on the last day of the month. Price fluctuations during the rest of the month are ignored.
- All data series are total returns, including dividends, and updated monthly.
- Treasury bill returns are based on 90-day paper.
S&P 500 FROM 1900 – 2016
Figure 3 shows the annualized returns for the S&P 500 and the TAA method for the past 100+ years. The table reveals that the TAA method improved annual returns AND reduced risk, all while being invested in the market approximately 70% of the time and making less than two trades per year.
Figure 3: Buy & Hold Returns vs. TAA Returns (1900-2017)
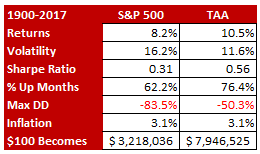
One interesting observation is that the TAA system achieves these superior results even though it underperforms the index in roughly one-third of all years since 1900. One of the reasons for the overall outperformance is the lower volatility of the TAA system. High volatility hurts portfolio returns.
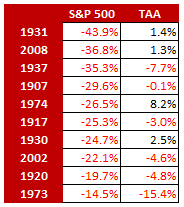
Figure 4 presents the ten worst years for the S&P 500 over the past century, and the corresponding returns for the TAA system. This table illustrates the ability of the TAA model to stay invested in stocks during up markets while switching to Treasury bills during down markets.
Figure 4: S&P 500 Ten Worst Years vs. TAA, 1900-2016
The Secret Sauce of TAA: Lower Volatility
One of the benefits of a mechanical, rules-based system like the TAA is that it protects the investor from mental errors and behavioral biases. As far as excess returns are concerned, for someone to gain, someone else must lose. People consistently make the same mistakes that are hard-wired into their brains, and the money they leave on the table is up for grabs. TAA is one way to capitalize on this phenomenon.
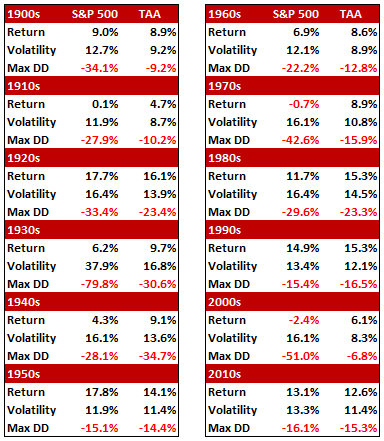
Figure 5: S&P 500 vs. TAA Returns by Decade
Expected Returns of Various Asset Classes
Looking forward, investors are faced with the following choices for where to invest their serious money. The expected returns shown here are based on a combination of sources that have demonstrated above-average forecast accuracy in the past.
- Emerging Market Stocks: 6.6% nominal, 3.6% after inflation
- Foreign Developed Mkt Stocks: 5.9% nominal, 2.9% after inflation
- US stocks: 4.8% nominal, 1.8% after inflation
- US REITs: 4.3% nominal, 1.3% after inflation
- Commodities: 2.7% nominal, -0.3% after inflation
- Gold: 2.2% nominal, -0.8% after inflation
- US Bonds: 1.3% nominal, -1.7% after inflation
(Source: GMO; Capital Spectator; Jack Bogle; UBS.)
When we weight these asset classes by their share of the global investable market, we get a blended expected return of just 1.4% after taking inflation into account. The knee-jerk reaction among many investors to these paltry expected returns has been to move farther out on the risk scale. In my opinion, that is a very dangerous way to boost returns.
Why not consider the alternatives? It’s not that hard to build and maintain a simple trading discipline. The TAA approach, using moving averages, is a risk-reduction technique that signals when you should reduce your exposure to risky asset class (such as stocks) in favor of risk-free investments (such as Treasury bills).
And here’s the beauty part: you can do this yourself, without any help from a broker, advisor, or planner. That will save you an additional 1% to 2% per year in fees. But remember that this strategy requires you to be proactive. If you get lazy or forgetful, you are likely to miss the warning signs that this strategy gives you. That will put you right back to where you were before – just sitting still and taking the pain.
Conclusions
The purpose of this article was to offer an alternative to the buy & hold approach. TAA is a simple-to-follow method for managing risk. A trend-following model such as the TAA acts as a risk-reduction technique with no adverse impact on returns. Utilizing the TAA system, an investor can significantly boost risk-adjusted returns.
In my next article on this topic I will describe a strategy that uses economic recessions as a driver of the asset allocation mix of your portfolio.
Thanks for your comments. The investment industry uses arbitrary start and end dates for their performance advertising. I try to use consistent start and end dates. so that my readers can make fair comparisons. If you are a beginning investor, it’s very important that you vet your information sources because the industry puts out exaggerated claims and false narratives. I have the luxury of being 100% independent, which affords me the ability to tell the truth without fear of retribution by the establishment.
Hi Erik
I wanted to thank you for sharing your expertise with me. I read an article by you on Seeking Alpha and then visited your website. I am wondering about the max DD of your TAA system of -50.3% in the S&P comparison box above and it doesn’t show up in the decade by decade box below it? Thank you again. I really enjoyed your article on SA of the recession warning overlay system you use. I’m a beginning investor (and a full time ICU nurse) and want to avoid making major mistakes.
James Reed