

“I've seen the needle
And the damage done
A little part of it
In everyone
Every junkie's like a setting sun”
-The Needle and the Damage Done, by Neil Young
Stock Market Junkies
The junkies of today are the eternal optimists who show up to buy every dip in the stock market. They can’t help it because they’re addicted to rising prices. Neil Young was referring to junkies of a different kind – heroin addicts. But the stock market junkies failed to show up today, and there was some damage done as a result.
On January 27th I said this in an article:
“Today was a bad day, but not a bull market killer. What would really concern me would be a failed attempt at a rally to new highs, followed by a close below today's level. If that were to play out, all bullish bets are off for me.”
Today, January 31st, it came to pass. The market took a serious hit on January 27th, but the optimistic dip-buyers rushed in to save the day. Unfortunately for them, they failed to push the market to a new high, and today the market took a second, even more serious hit. This looks like a broken trend to me.
A broken uptrend
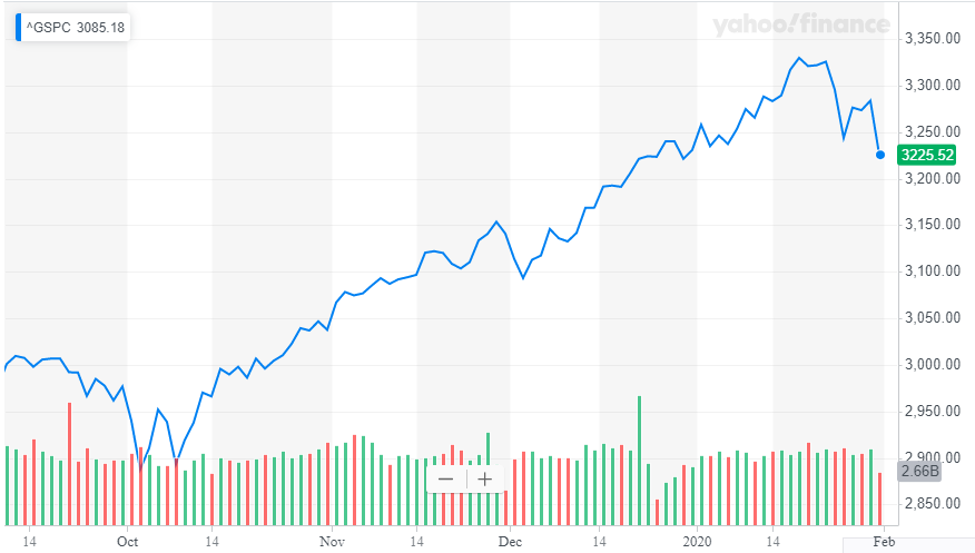
Does the chart above look like a broken uptrend to you? I suppose not, if you’re a bull market junkie. You followed the script and dutifully bought the January 27th dip. But now those trades are under water. What will you do? You didn’t buy today’s dip, but will you step up to the plate on Monday?
There will probably be a bounce on Monday, but how firm is your commitment to buying into it? Will you buy at the open, or wait and see how things play out? And by the way, after buying all the dips along the way, how much ammo do you have left to buy this one?
Many of these bullish junkies claim that they only buy and never sell. It takes cash to buy if you never sell. Does that mean that bullish junkies are sitting on hidden cash reserves? I hope not, because that would compromise their stature as an all-in bull.
Here’s how I’m going to play this market.
I’m going to take a defensive stance. That means avoiding zippy momentum names – especially the recently listed companies with no earnings in sight. I’m moving towards high quality, low volatility names instead. For sectors I like Utilities and Telecoms. Health Care should hold up too, given the fear of a pandemic.
I wrote the following in a note to clients this morning:
“How much longer will this selloff go on? It could continue until one or more of these things happen:
- The WHO announces that they have an effective vaccine for Coronavirus.
- The Fed lowers short-term rates another notch and/or injects more stimulus into the financial system.
- Corporate earnings begin to accelerate in a big way.
- China reopens her factories and returns to business as usual.
- The Dip-buyers regain their composure and begin to bid up prices again.
- We get another strong employment number next Friday, with healthy wage growth.
- The U.S. and China jointly announce an accelerated Phase 2 trade deal.
None of these things are likely to happen but hope springs eternal and the bull market isn’t dead yet.”
Let’s run through some charts to assess the damage done last week
Chart 1. The percent of stocks that are trading above their 200 day moving averages.
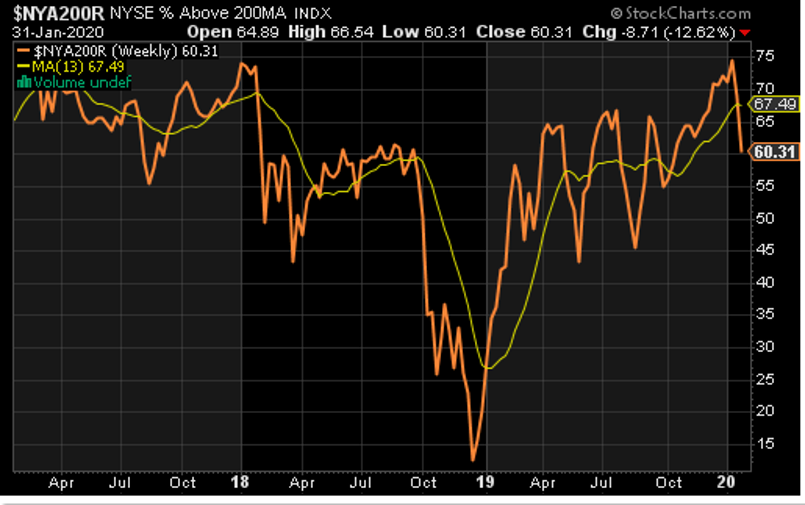
Until last Monday this chart was looking good. 75% of stocks were trading above their 200 day moving averages. After the brutal week just past, that number is down to 60%. Still a majority but slipping fast.
Chart 2. Percent of stocks trading above their 50 day moving averages.
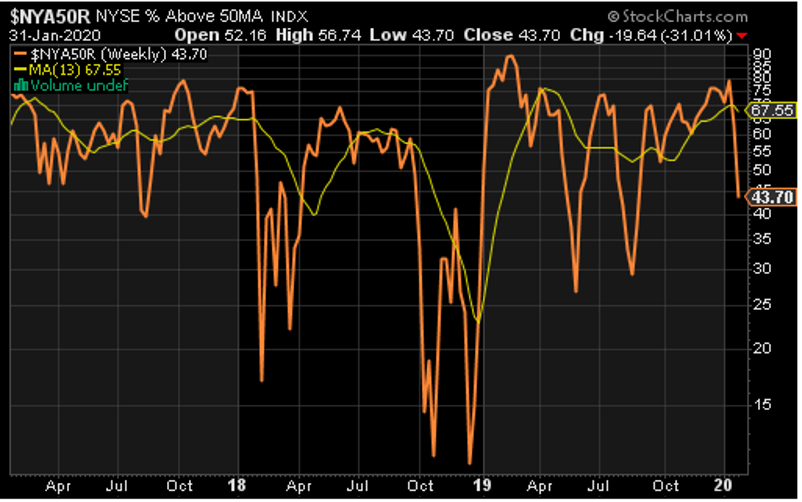
Shorten the time frame from 200 days to 50 days and the picture gets worse. Just 43% of stocks are above this key level. More stocks are below than above it.
Chart 3. Momentum stocks vs. the S&P 500 index
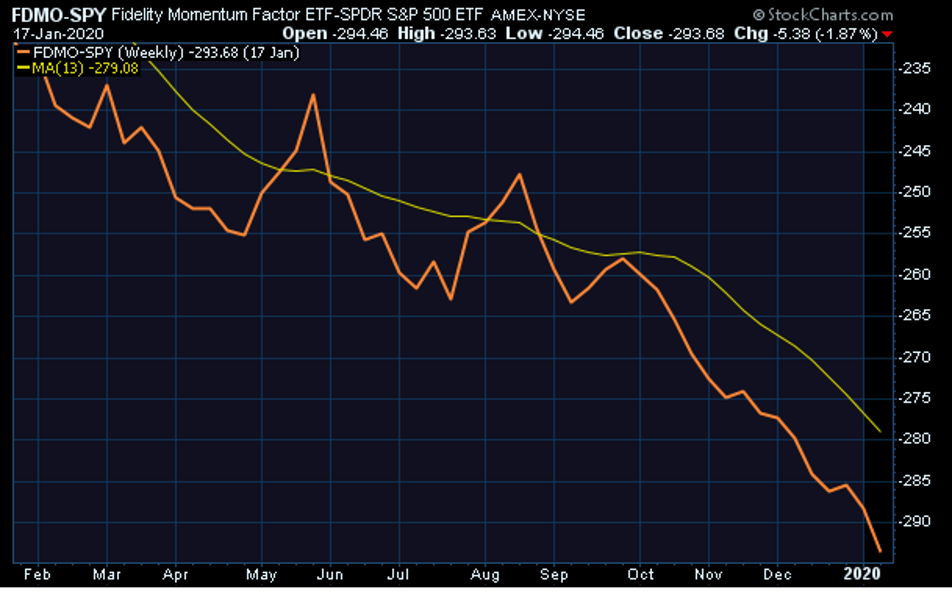
This is a 1-year chart of momentum stocks relative to the market. Momentum as a factor hasn’t been working for more than a year, and it appears to be getting worse. In theory, momentum stocks should lead the market higher, not lag the market. Something odd is going on here. If you have an explanation, please comment below.
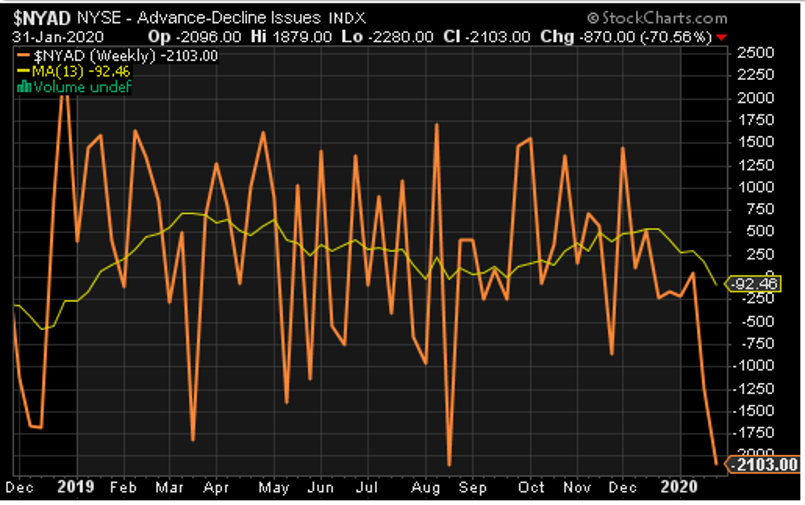
Chart 4. Net of Advancing stocks over Declining stocks
I should probably have led with this, but I saved it for last to get maximum impact. The A/D line has cratered. It’s worse today than it was in December 2018 after a 20% market drop. What this chart tells me is that the selling today is indiscriminate. It has an air of desperation approaching panic.
Final Thoughts
Look for a bounce next week as cooler heads prevail. The Dip-buyers have scurried, but they will return. Will they be able to push the market to another new high? That’s the $64,000 question.