
Investors who prefer to do their own research, and pick the stocks that they believe are poised to deliver stellar returns, face a daunting task. How do you determine which of the 10,000 stocks that are available in the U.S. are the most likely to outperform the rest of the market?
One way to approach this challenge is by using screens to filter out the weaker stocks and boil the list down from 10,000 candidates, to a more manageable list of just 7. I’ve been doing this for clients since 2005. Here’s how it works.
Fundamental Analysis looks at the relative valuation and future earnings growth for a stock. Technical Analysis, on the other hand, shows the demand for a stock and how the stock has been trading in the past. Investors usually fall into one of these two camps, and devote most of their research efforts to either Fundamental metrics or Technical ones.
Why not use both at the same time? My strategy looks for stocks that pass both fundamental and technical screens. You might describe it as “momentum at a reasonable price.”
The Methodology
Fundamental Screens
Starting with a universe of roughly 10,000 stocks, the first step is to look for those stocks that have solid fundamentals. I apply several screens that look at fundamental metrics like valuation, earnings growth, and profit margins. I then consolidate the results into a single fundamental grade of A through F. Only stocks with a fundamental grade of A or B are allowed past this hurdle.
For valuation metrics I look at ratios, like price/sales, price/book value, and price/earnings. By comparing each stock to its industry peers, I only accept the ones that are below the median. In other words, they’re relatively cheap.
Next I run a screen that looks for expected earnings growth over the next year. Qualifying stocks will have earnings and revenue growth estimates that are above the median for their respective industries.
The screen for profitability includes metrics like return on equity, improving margins, and earnings quality and sustainability.
After all of the fundamental screens are run, the universe of candidates is reduced from 10,000 down to roughly 2,500.
Technical Screens
The first technical screen looks at trading volume. I want to make sure that the final list of candidates have enough daily trading volume to support a buy order of 10,000 shares without attracting too much attention.
Next I look for stocks with steadily increasing trading volume over the last three weeks. This indicates that general interest in the stock is increasing rather than waning. It also provides an indication of increasing institutional buying in the stock.
These screens reduce the list of candidates from 2,500 down to roughly 700. The final step is to look at the price history of these stocks.
The next set of screens looks at price action. First, I only consider stocks that are trading above certain moving averages.
- The 10 day moving average must be above the 50 day moving average.
- The current price must be above the 50 day moving average.
- The 50 day moving average must be above the 200 day moving average.
These price screens reduce the number of candidates from 700 down to roughly 150.
The final screen looks at the sector (using the 11 primary sectors of the S&P 500) and the industry group that these 150 candidates are in. I screen out any stock that is in a sector or an industry that is on the decline. The reason for this is that due to the proliferation of index ETFs and sector rotation strategies, stocks have a strong tendency to trade in line (high correlation) with the group and sector that they are part of. Even a cheap stock with good technical strength can be pulled down by virtue of the company it keeps.
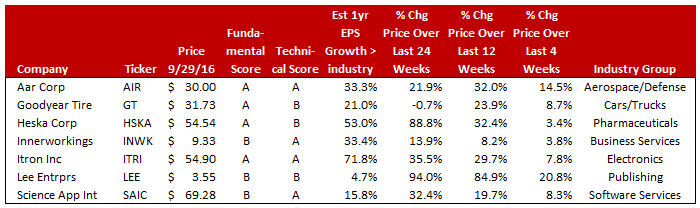
After all screens have been run, the list of candidates is down to just 7 names. Here are the 7 names that came through the most recent screening process.
How to Trade the Strategy
There are two versions of the trading strategy. The most active is the 1-week holding period. Very few of my clients have the time or patience to commit to a trading regimen that is this active.
The other version is the 4-week holding period. This version is easier to manage, less time consuming, and less expensive to implement than the 1-week version. The results of the strategy shown below are for the 4-week holding period version. Requests for the results of the 1-week version can be obtained by sending an email to info@zeninvestor.org with the subject line “Weekly Trading.”
Asset allocation and rebalancing
All stocks are purchased with an equal dollar amount. At the end of each 4-week holding period, the strategy is rebalanced, keeping the stocks that remain qualified, selling the stocks that no longer qualify, and replacing them with new stocks that qualify.
The Results
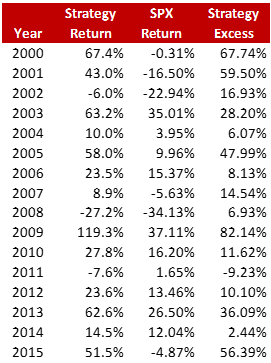
Over the last 16 years (2000 – 2015), this dual-screen strategy has produced an average annual return of 28.6%.* The table below shows the returns for each year.**
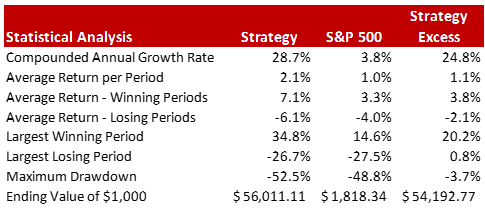
The table below shows the statistical analysis of the strategy.
*Please note that with any trading strategy, past results may not be duplicated in the future. There is always risk of loss in any strategy, regardless of its past success.
**I have been using the 4-week version of this strategy with clients who are active stock traders since 2005. The performance record prior to 2005 is the result of back-testing.
Great, thanks for sharing this info.