
Weekly Market Scorecard – February 17, 2017
- The S&P 500 is up 22.6% from a year ago.
- It’s up nearly 10% just since the election.
- The rally is being driven by optimistic expectations.
- One of those is a belief that earnings will accelerate.
- Investors are 100% on board with Trump’s pro-growth agenda.
But first, let’s review the market internals for the two weeks just passed.
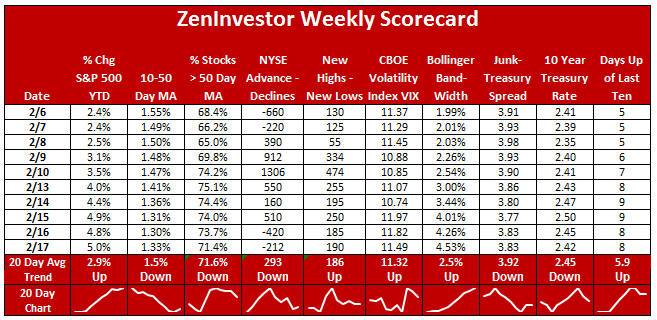
The table above keeps track of the level and trend of ten measures of market health. These are often called “market internals” because they reveal what’s going on below the surface – the headline price of the market.
Of the ten indicators, five are trending higher and five lower. This even split contradicts the fact that the market has been making new highs for several weeks now. That’s important information to have, since most retail investors only look at the headline number and listen to the bullish spin articulated by the talking heads on financial media outlets. It pays to dig a little deeper than that.
The headline number, as represented by the year-to-date percent change of the S&P 500 index, is a very healthy 5%, and rising. Short-term momentum, as measured by the gap between the 10 day moving average and the 50 day, is falling. This tells me that traders with shorter time frames are starting to pull back just a little.
Market breadth, as measured by the percentage of stocks that are above their 50 day moving average, and the advance-decline line, is trending lower. But the number of stocks making new highs minus those making new lows, is now widening after narrowing for the last couple of months.
Volatility, as measured by the VIX and Bollinger Band readings, is rising. Investors are optimistic, but they are a little less so than a few weeks ago.
The spread between junk bond rates and Treasury bond rates is narrowing, which supports the idea that investors are confident about taking more risk in their search for yield.
Lastly, the number of up days out of the last ten trading days is at a bullish reading of 8.
The Trump Rally
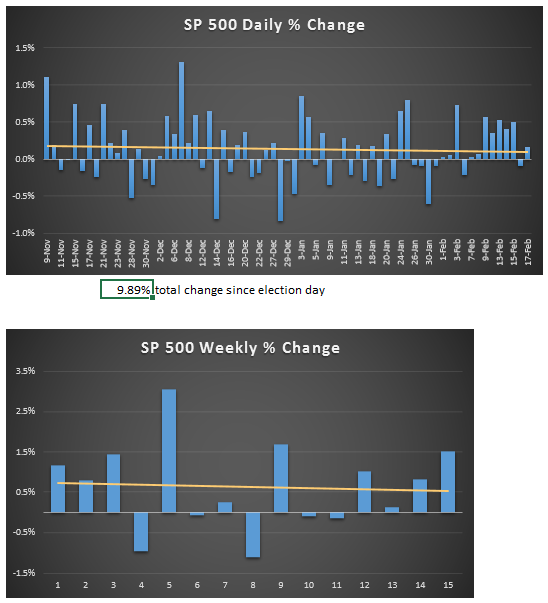
As you can see, the market trend is up, but the pace of the increase is slowing. The yellow line on the above charts is a simple trend line, which shows a slight downward trajectory of both daily and weekly gains in the market since the election.
Top performing market sectors
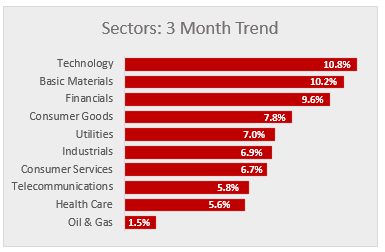
Looking at the performance of the ten primary market sectors over the three months since the election we can see that Basic Materials, Technology, and Financials have been leading the market higher. Energy, Health Care, and Telecom are lagging behind.
Top performing industries
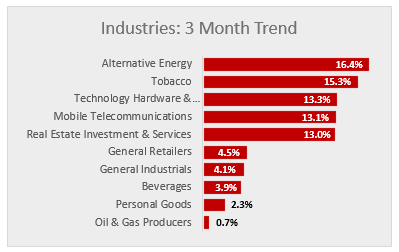
The surprise of the last three months is the strong performance of the Alternative Energy industry. I admit that I’m a little baffled about what may be driving this move, but I think there’s something going on. It flies in the face of the fact that Trump is pro-fossil fuel and by default that means anti-alternative energy. I don’t get it, but it is what it is.
Some takeaways
The bulls are still in charge. Investors don’t seem to care about what’s happening in Washington. They’re clearly focused on the possible benefits of Trump’s pro-growth agenda. But I think that certain risks in the market are increasing. Valuations are stretched, investors are showing signs of complacency, and expectations for a fast rebound in earnings might be too optimistic.
Trump has a golden opportunity to boost economic growth, bring back factory jobs, and renegotiate unfair trade deals. I hope he will deliver on these promises.
“In the short term, the market is a voting machine.
In the long term, it’s a weighing machine.”
-Ben Graham
Stay invested. Markets go down seriously when something interferes with economic growth..ie inflation, interest rates, currency collapse, commodity inflation or deflation (oil shortage years ago) (oil bust recently) etc… Or when there are no or little earnings to support the latest fad as in the dot com bust etc…
And none of these events are here now.
Are you really located in Mundelin, IL? Small world. 1991, 1992 and 1993 I was completing the building of a home in Lake Barrington, IL. I worked full time at Ameritech. Saturday nights I would go to Mundelin to get materials for myself and the people helping me. The house was 24816 Cherokee Drive, Lake Barrington, IL 60010 if you want to look it up on Zillow.com. Turned out to be a beautiful house and lot.
I like Mundelin, lots of good people there.