
Highlights
- The post-election rally is still intact, and making new highs.
- The S&P 500 is up 15% since the election, and probably has more upside.
- Investor optimism is high, but so are the risks of a negative geopolitical event.
- Most industries that got a big boost post-election have now given it all back.
Barron’s Editorial
Before we get into the numbers, I want to mention a Barron’s editorial this week that draws a comparison between The Trump administration and the Carter administration. What caught my eye was this quote:
“The Republican government that controls the White House, the Senate, the House of Representatives, and the bureaucracy has been unable to convert its majorities into enactment of its most emphatic promise. Without sudden changes of heart somewhere, there will be no repeal and no replace. Obamacare will remain the law of the land, and the Republican Party will continue as a house divided against itself”
Why am I bringing this up? Because there is an assumption among investors that Trump, with the help of a Republican majority in Congress, will deliver what he promised on the campaign trail. The market is rallying in anticipation that most of his pro-growth agenda will be implemented. But Jimmy Carter thought the same thing in 1976, and he ran headlong into a wall of obstacles that kept him from getting his agenda passed.
Trump could learn a few things by reviewing Jimmy Carter’s similar problems. He ran for president as an outsider, and turned his inexperience into an asset on the campaign trail. Carter promised never to lie to the American people. He promised to simplify the income tax system, and close loopholes. He railed against the “horrible, confused, bloated bureaucracy” and pledged to reform it. He promised to put an end to “secretive, amoral” diplomacy. And he promised to take care of everybody by enacting universal health care.
Unfortunately, few of these ideas ever gained much traction. The Iran hostage crisis. Runaway inflation and interest rates. Long lines to buy gasoline due to rationing. When you think big, as Carter did and Trump does now, you must be able to motivate others to work with you. Carter found out that his reach exceeded his grasp. Will Trump follow in his footsteps? Food for thought.
Trump rally still going strong
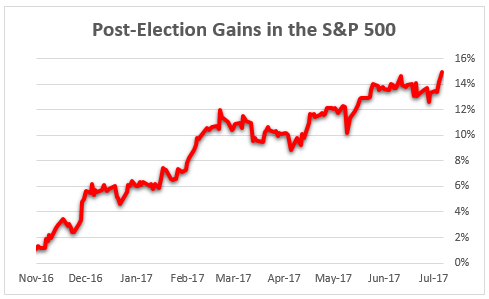
The fact that investors are still optimistic about tax cuts, infrastructure spending, and deregulation is evident in the above chart. But health care reform is proving to be problematic. If Trump’s approval rating continues to drop, there may come a time when Republican leaders in Congress begin to lose faith in his ability to deliver on campaign promises.
The weekly chart since the election shows the decreasing momentum
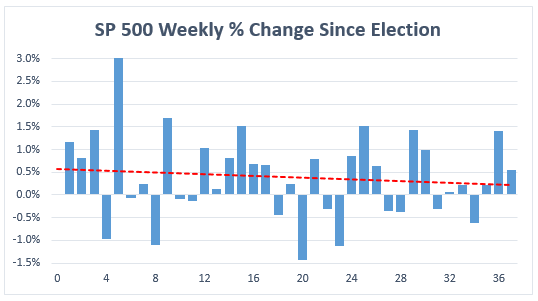
As the above chart illustrates, the weekly gains started out strong for the first 9 weeks or so, but since then have been getting smaller. The dashed red line shows the trend of weekly gains since the election.
The current health of the market
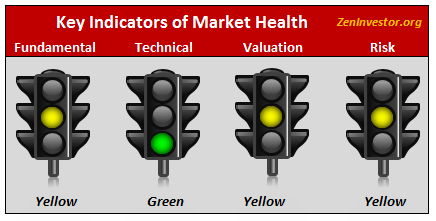
The picture you see here is a visual summary of the four main indicators of market health. With three yellow and one green light, it’s fair to say that the market is not in peak health right now. But it’s also fair to say that it’s not about to collapse anytime soon, as indicated by the absence of any red lights.
Each of the four main indicators is made up of several sub-indicators. For example, one of the sub indicators of the fundamental light is the trend and quality of corporate earnings. To arrive at the colors of the traffic lights, we start with the twelve sub-indicators, which feed into the main indicators, and finally into our overall assessment of market health.
What is an investor to do when the lights are in this condition? Stay invested. As I’ve said many times, this is not the time to fight the tape. If you’re worried, take a little (5-10%) out of your equity allocation and put into your cash allocation. The lights will tell us when it’s time to play serious defense.
What’s going on below the surface of the market?
Let’s take a look at the market internals to find out what’s going on below the surface of the market.
Of the ten indicators we track, only three are trending higher, while seven are trending lower. There is no cause for concern at this point, because these are short-term indicators. They can reverse quickly, and they often do.
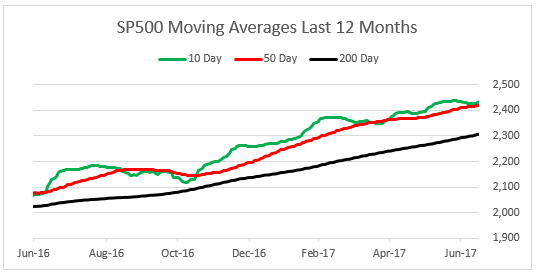
The first indicator, the year-to-date percent change of the S&P 500 index, is a very healthy 10.4%, and that makes the 2017 market one of the strongest first half performer since 1950.
Short-term momentum, as measured by the gap between the 10-day moving average and the 50 day, is relatively weak but still positive. This tells me that traders with shorter time frames are becoming more cautious.
Market Breadth and Volatility
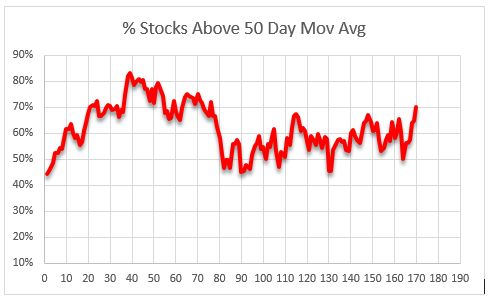
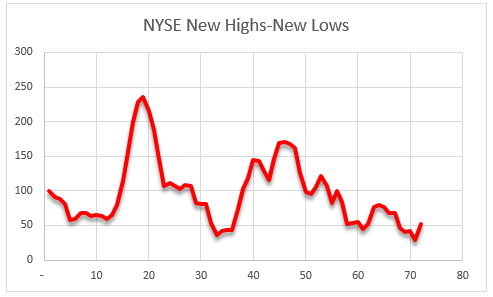
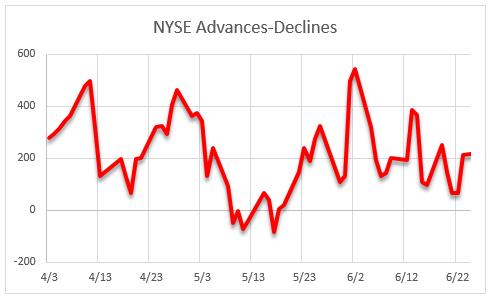
Our three measures of market breadth – the percent of stocks trading above their 50-day moving average, advancing stocks minus declining stocks, and new highs minus new lows – are showing positive trends. This means that market leadership is broadening. Tech, Financials, and Industrials have been carrying most of the load as the market continues to set record highs, but the other 7 sectors are lagging.
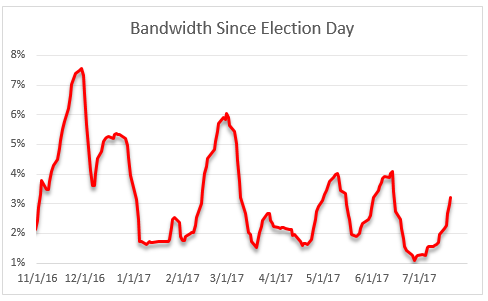
Next we have our two measures of price volatility – the VIX and Bollinger Band readings. They too are trending lower, as they have been for most of this year. What does it mean? Investors are not worried about a big decline any time soon. The market is still very quiet relative to historical readings, but pressure seems to be building for a burst of activity.
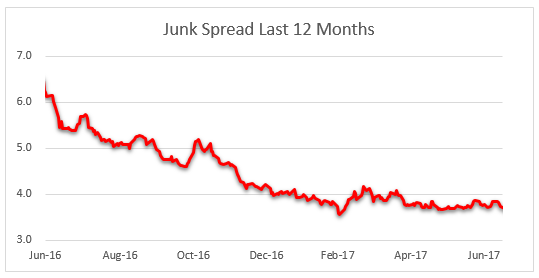
The spread between junk bond rates and Treasury bond rates is very narrow, which could indicate a worrisome complacency on the part of fixed income investors.
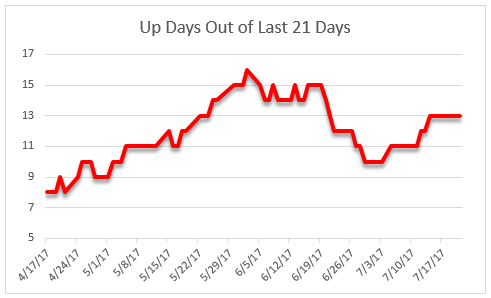
Lastly, the number of up days out of the last 21 trading days has slipped from 16 to 13 over the last month. That’s a moderate reading, and no cause for concern.
The Earnings Picture
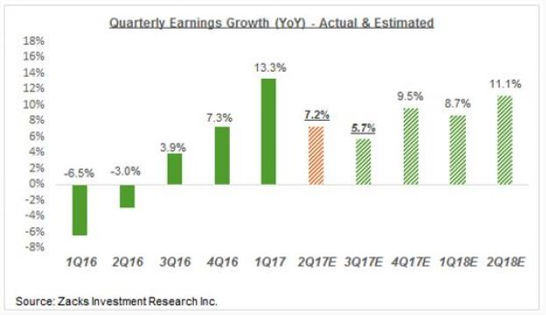
The above chart speaks for itself. Earnings are strong, and look to stay that way for a while. But, to catch up with valuations, we’re going to need the economy to speed up. 2% just won’t hack it. We need 3-4%, which is another campaign promise by Trump.
Plot of the year-over-year % change in the S&P 500 index
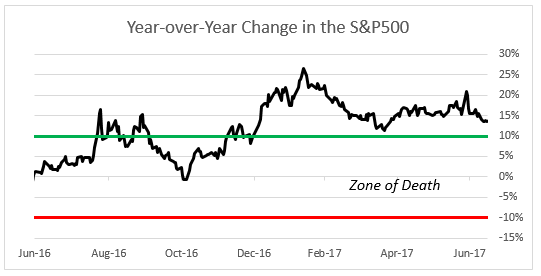
The black line on this chart tracks the difference between where the market is trading today, as compared to where it was trading last year at this time. The green line shows the boundary between a typical healthy market (one that is up at least 10% from the prior year) and a market that is struggling to stay healthy.
The red line shows the boundary between a market that’s struggling to remain healthy (one that is trading between up 10% and down 10%) and one that’s in trouble (below -10%).
The term “Zone of Death” describes the area of this chart between the green and red lines. When the market enters the ZOD, it tends to succumb to a kind of gravitational pull, where it moves quickly from one boundary to the other. The closer it gets to the center of the ZOD, namely the 0% line, the stronger the gravitational pull becomes.
Today the market is comfortably above the top of the ZOD, which indicates optimism and bullishness. When the market penetrates the green line from above, it’s time to pay closer attention. Conversely, when the market penetrates the red line from below, it’s an indication that things are improving and better days are ahead.
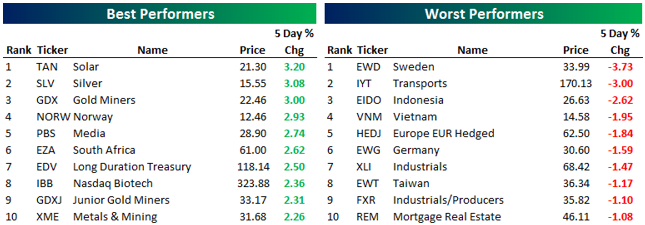
ETF Box Score Last 5 Days
Some takeaways
The near-term picture for stocks and the economy has improved recently. While valuations are stretched, investors apparently believe that the strong earnings rebound will continue, and cause valuations to become more reasonable. They still believe that the promised benefits of Trump’s pro-growth agenda will become reality. This bull market is likely to continue, until valuations become too stretched or investors start to lose confidence in Trump’s agenda.