
Bear Markets (part 3)
In my last article I presented a birds-eye view of the 4 most destructive bear markets in history – 1932, 1974, 2000, and 2008. I call these “super-bears” because of their enormous destructive power. They are like a category 5 hurricane, while the typical bear is a category 2 or 3.
In this article I will drill down into each of these super-bears with the goal of discovering clues about how to anticipate, react to, and even take advantage of them. I will illustrate the destructive power of these events by looking at the damage they cause to wealth, and in terms of lost time. Wealth can be restored over time, but time itself can’t. In this way, I argue that the permanent loss of time is even more harmful to investors than the temporary loss of wealth.
Table 1. Summary of all long-term bull and bear markets from 1877 to the present.
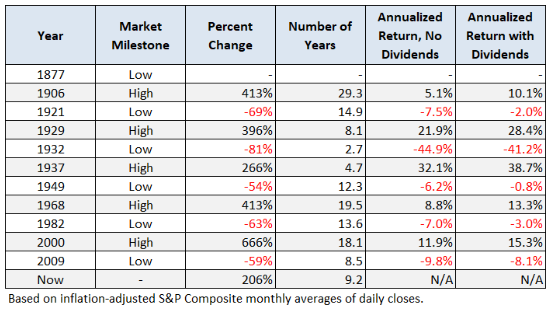
Chart 1. The Crash of 1929, otherwise known as MOAB – the Mother of All Bears.
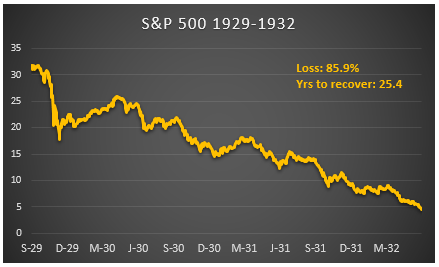
Chart 2. The 1973-74 OPEC Oil Shock Bear Market.

Chart 3. The Bursting of the Tech Bubble in 2000.
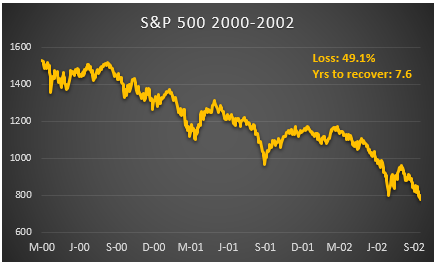
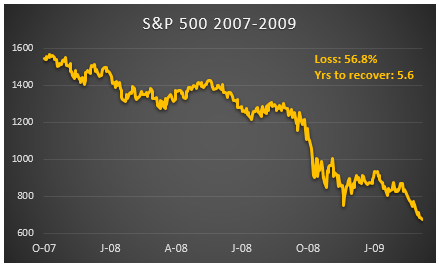
Chart 4. The Global Financial Crisis of 2007-2009.