

Bear Markets (part 2)
In my last article about bear markets I referenced the four most destructive bears of all time: the Crash of 1929, the Oil Embargo of 1973, the Tech Bubble of 2000, and the Global Financial Crisis of 2007. In this article we will take a close look at each of these market events and look for ways we might learn from them.
I will use the historical record to underscore the importance of understanding just how destructive these “super-bears” can be. Most retail investors will be better off with a simple buy & hold strategy that ignores bear markets, but for those who have the time and motivation, there are steps you can take to dampen the impact of these events and significantly boost performance over the long-term.
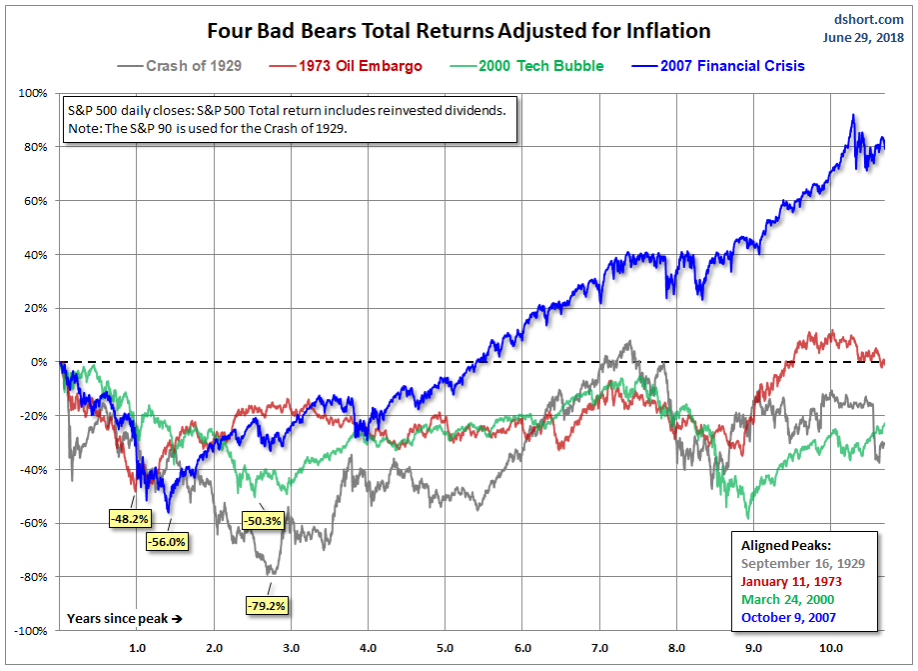
First up is a great chart from Doug Short and Jill Mislinski from Advisor Perspectives. This chart combines all four bears, from their peak price to 10 years later. This chart sets the table for our analysis and provides an easy comparison of the severity of each bear market, and how quickly they recovered. Take a look, and we’ll talk about it on the other side.
Chart 1. All four bear markets in one chart.
Observations
The two key features of these four super-bears are their severity and their duration. Typical bears produce a decline of 27% or so, and last about 18 months. Most investors can tolerate this level of pain without becoming excessively stressed. But the bears we’re describing here are not typical. They are Secular (long-lasting, deep cutting), and I argue that they can, and should, be managed proactively. Below is a simple recap of each of our Secular bears, with the total price decline from peak to trough.
[two_third_first]Bear Market Event[/two_third_first][one_third_last]Price Decline[/one_third_last] [two_third_first]Crash of ’29[/two_third_first][one_third_last]-79.2%[/one_third_last]
[two_third_first]Oil Shock of ’73-’74[/two_third_first][one_third_last]-48.2%[/one_third_last]
[two_third_first]Tech Bubble of 2000[/two_third_first][one_third_last]-50.3%[/one_third_last]
[two_third_first]Financial Crisis of ’07[/two_third_first][one_third_last]-56.0%[/one_third_last]
These Secular bears are deeper (average decline of 58% versus 27% for garden-variety bears). Even more damaging to the investor is the amount of time it takes to get back to even. Typical bears recover in 18 months or so. Secular bears take an average of 9 years to recover. I don’t think it makes much sense to sit and wait for 9 years to get back to even. Do you?
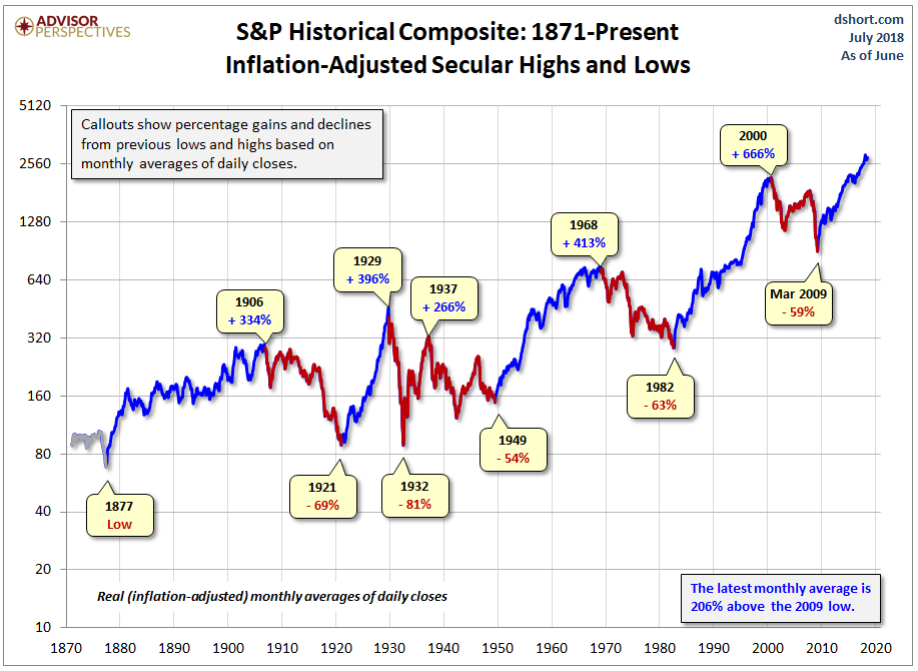
Next up is another Doug Short-Jill Mislinski chart that highlights all of the bull and bear markets we’ve experienced since 1877. The numbers in this chart are adjusted for inflation.
Chart 2. Secular (long-term) bull & bear markets
Observations
These long-term bull and bear markets take roughly 20 years to unfold. That’s great when the market is going up, but when it’s going down, the damage to wealth and optimism is far worse than many realize. Take the super-bear of 1929 for example. After adjusting for inflation, it took until 1954 for the market to fully recover. Granted, this is an exceptional period in our economic history. But if you don’t think it could happen again, you’re kidding yourself.
The counter-argument is that nobody just sat on their money for the whole 25 years. They bought more stock as the years went by, at lower prices, which brought down their average costs. I’m willing to grant that, but it does not negate the fact that money invested in 1929 was dead money until 1954.
One other observation before we move on is the greatest bull market in history – 1982 to 2000. As you can see on the above chart, the market gained 666% in real terms over this 18 year period. This caused an entire generation of investors to believe that the market could only go up, and corrections were short and shallow. This set them up for a rude awakening in 2000, when the tech bubble finally burst.
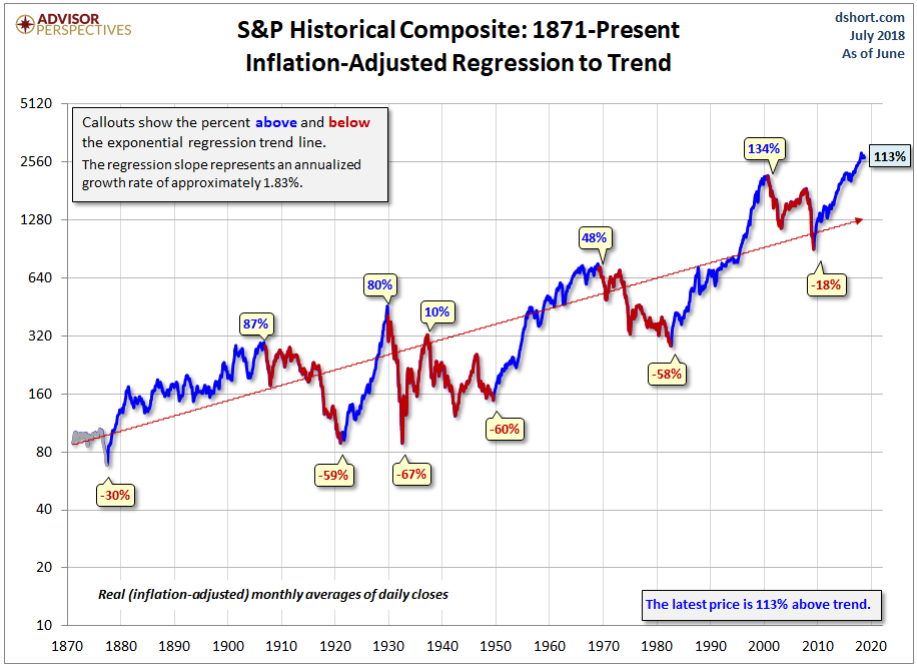
Next up is the same long-term chart, again from Doug and Jill. But this time with a long-term trend line. The callouts mark how far above and below trend each of the secular moves were.
Chart 3. Secular bull & bear markets with trend line.
Observations
When I first saw this chart, what stood out for me was the peak of the 1982-2000 secular bull market. At 134% above the long-term trend, it blows away the 80% overvaluation at the peak of the 1921-1929 bull run. If anyone tells you that today’s market is not that stretched, ask them this question: How far above trend would the market have to be before you considered it to be highly overvalued?
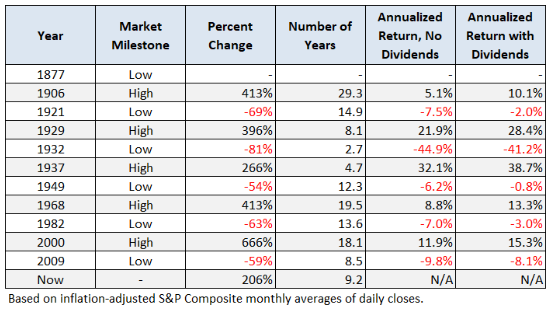
Chart 4. Details for secular bulls & bears
Observations
Looking at the table above we see that there have been a total of 80 years of secular bull markets, and 52 years of secular bear markets – a 60:40 ratio. If we consider the fact that the market is in bear mode about 40% of the time, we can better understand why it’s so important to reduce equity exposure during these long market downturns. It’s not just about saving money, it’s also about saving time. If an investor can avoid even half of this 40% of bear market action, he or she will reach their financial goals far sooner than a traditional buy & hold investor.
Final Thoughts
This article presented a birds-eye view of the long-term trend of the stock market. It highlighted the secular bull and bear periods, and the 4 worst bear markets of all time. In the next chapter we’ll drill down into each of the 4 super-bears and look for clues that might help us recognize the next one when it comes calling.
Very interesting. It would be nice to see these charts presented on a natural log scale.