
According to a 2017 study by Robin Greenwood, Andrei Shleifer, and Yang You from Harvard University Business School, the answer is yes. The study, titled Bubbles for Fama, reached 4 main conclusions:
- Eugene Fama, Nobel Prize winning economist and pioneer of the Efficient Market Hypothesis, is correct when he argues that a sharp price increase of an industry (asset class) does not, on average, predict unusually low returns going forward;
- Such sharp price increases predict a substantially heightened probability of a crash;
- Attributes of the price run-up, including volatility, turnover, issuance, and the price path of the run-up can all help forecast an eventual crash and future returns; and
- Some of these characteristics can help investors earn superior returns by timing the bubble. Results hold similarly in US and international samples.
Laying out the parameters
For their study, the authors defined a bubble and a post-bubble crash in very specific terms.
- The average price of an asset class (industry) has increased by 100% in nominal terms over the previous two years;
- The two-year price increase must also be 100% above the market return (alpha);
- A post-bubble crash is a market decline of at least 35% over 24 months;
- A post-bubble non-crash is a market decline of no more than 35% over 24 months (a typical bear market).
Key findings
- From 1928-2012 there have been 40 instances where an industry has met these two criteria;
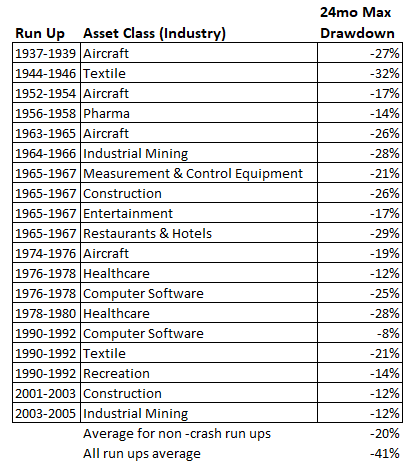
- These 40 instances are then separated into two groups – those that were followed by a crash of 40% or more, and those that were not followed by a crash;
- The baseline probability of a crash at any point in time is 20%;
- If the asset has run up by 100% over the previous two years, the probability of a crash increases to 53%;
- If the asset has run up by 150%, the crash probability goes to 80%.
(The authors make a clear distinction between predicting future returns and calculating the likelihood of a crash.)
How does one recognize an asset bubble before it pops?
This is the proverbial $64,000 question, and the authors found some important clues to unlock this mystery. Their discoveries do not offer anything like a foolproof method of bubble detection. Rather, they give investors enough information to estimate, with sufficient accuracy, the probability of the bursting of an asset bubble. If the investor has prepared a robust defensive strategy for this kind of occasion, she will be able to achieve superior returns (alpha) and sidestep the worst part of the ensuing price decline. Preparation is essential to make this work.
The indicators of an asset bubble
In addition to the price run up parameters explained earlier, there are 9 coincident indicators that can add to, or detract from, the accuracy of the probability estimate.
- Volatility
- Volume
- Age of firms in the industry
- The profitability of new companies versus older ones
- Stock issuance
- Book-to-Market Ratios
- Sales Growth
- The market P/E
- Acceleration (the abruptness of the price run up).
I will go into further detail about the above coincident indicators in a future article. For now, let’s take a look at the numbers from this study.
Table 1. 21 incidents of a predictable bubble followed by a crash
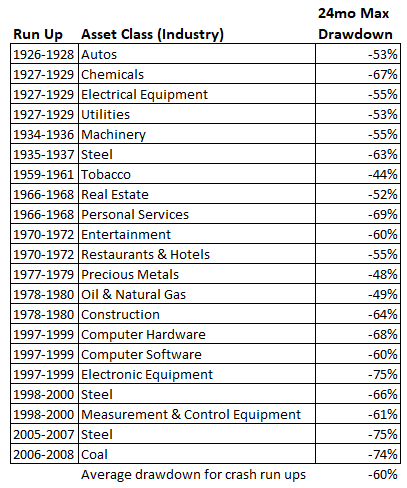
Table 2. 19 incidents of a bubble followed by a bear market but not a crash
(Related article – Expected Market Returns Next 10 Years)
Bitcoin is a digital currency (or cryptocurrency) based on the blockchain technology. The main value of bitcoin is that it cannot be forged or imitated on its own. But Bitcoin can be mined! What is Mining? Mining is the process of bitcoin getting.
I respectfully disagree with your argument. If it were true that the only indicator an investor needs is profits, then all stocks, industries, and asset classes would always be priced at fair value. That’s unrealistic. Assets swing from over to under valued due to investor sentiment. The 9 indicators help to identify when the asset is at one extreme or the other.
Erik,
You do not need 9 indicators to know if an asset bubble is about to break or for that matter if any stock is about to fall.
You need only 1 indicator–profits. If profits fall or the expectation of profits do not happen. Down goes the asset.