
A Recession Forecast Overlay That Boosts Returns by Cutting Risk
Getting up to speed
This is the fourth part of a series on avoiding bear markets, and how important it is for an investor to at least consider taking steps to avoid the great harm that bear markets can cause. If you missed any of the previous parts in this series, you can get up to speed with a quick review:
In part 1, I described in detail just how much damage bear markets can cause. I argued that an investor who was able to avoid even part of a bear market would benefit in three ways – they would be taking less risk (because they would be out of the stock market during the worst declines), they would earn higher returns (if you subtract out the worst performing months, your average returns go up), and perhaps most importantly, they would save the most precious of all resources – time. Bear markets take years to recover from. If you get out of the way, even for just part of the decline, you will reach your investing goals sooner, and with less risk, than you otherwise would.
In part 2, I offered a systematic way to protect your wealth from harm. That article focused on a very old, tried-and-true method of managing risk: the Moving Average Crossover.
In part 3, I introduced the idea of using a recession-forecasting model to mitigate the risk of enduring a bear market. I introduced three such models that are available commercially. Any of these models will do, but (here comes the shameless promotion) naturally, I would prefer it if you chose the model that I designed myself.
Today I will dive deeper into the way my recession-forecasting model works, and why you might want to consider adding it to your investing arsenal. Let’s get started.
The Link Between the Stock Market and the Business Cycle
A cardinal rule of investing is the ironclad link between risk & reward. Conservative portfolios generate lower returns than Aggressive portfolios. It’s a trade-off that all investors make: how much risk am I willing to take, in order to get the returns I need to meet my investment goals? The answer will be different for everyone. It’s a matter of personal preference. There’s no ideal balance between risk & reward, there is only the combination that will get you the highest possible return for the amount of risk you are willing to bear.
There is another ironclad link in investing: the link between the stock market and the business cycle. As the economy ebbs and flows, from fast growth to slow or negative growth, the stock market responds accordingly. When the economy is in recession, it is virtually guaranteed that a bear market will accompany it. In fact, the stock market usually leads the economy by several months. By the time it becomes apparent that we are in a recession, the stock market is already down by 10% or more. This is where the power of a recession-forecasting overlay resides.
What if an investor had some way to know, with a high degree of confidence, and with several months of advance warning, that the business cycle was about to peak and a recession was an imminent threat? Knowing that the market will probably drop sharply, the investor would be in a position to take defensive steps. By reducing or avoiding exposure to stock market risk, an investor could boost returns significantly.
I have, as do a few others, a forecasting model that does that, with an accuracy score of 88%. It’s based on Bayesian Probability Theory. It uses both economic and capital market inputs. I began developing my model in 1998, and started using it with clients in 2002.
It is not a stand-alone investment strategy, but rather an overlay to be used with any existing strategy. It operates quietly in the background, until a cycle peak is on the horizon. When it gives off a warning signal, the investor begins to implement a predetermined contingency plan, according to his or her own risk preferences.
Definition of terms
A Bear Market is a 20% decline or greater.
A Correction is a decline between -10% and -19.9%.
Since 1885 there have been 22 bear markets and 28 corrections.
A bear market begins on average every 5.6 years.
A correction begins about every 3.5 years.
The average duration of a bear market is 19 months from peak to trough.
The average time it takes to fully recover from a bear is 5.1 years.
The Link
In his classic investment book Stocks For The Long Run, Wharton professor Jeremy Siegel points out that almost without exception, the stock market tops out prior to business cycle peaks, and bottoms out before cycle troughs. Of the 47 recessions since 1802, 43 of them (9 out of 10) have been preceded (or accompanied) by declines of 10% or more in the stock market. This is the core idea that drove my inquiry into The Link Between The Stock Market and The Business Cycle.
The stock market tops out and begins to decline before the economy rolls over. Lead times vary, but the market can hit its peak as much as a year before the onset of a recession. The recessions of 1980 and 1990 are the exceptions that prove the rule. In these two cases the market gave no warning of an impending economic downturn.
The stock market is also prone to false alarms. Since 1802, there have been 12 instances where the market fell by 10% or more, but there was no recession within the next 12 months. Perhaps the most infamous episode was the market crash of 1987, where the decline in stocks was so dramatic and severe that there was a nearly universal belief that a recession would soon follow. Alas, it failed to show up.
The average lead time between a stock market top and a business cycle peak is 5.7 months. The average lead time between a market bottom and a cycle trough is 4.8 months. This brings up an interesting question. If one could anticipate, with even a modicum of accuracy, the onset of a cycle peak, would that help investors to protect their portfolios by “getting out of the way” of the recession?
That’s one of the key points of this inquiry, and I will attempt to arrive at some conclusions by studying each of the bear market events that took place during the last 50 years. (I won’t tackle all of them in this article. I’ll break my analysis down into more digestible pieces over the next few articles on this topic.)
The history of economic expansions
Chart 1. Where we are now
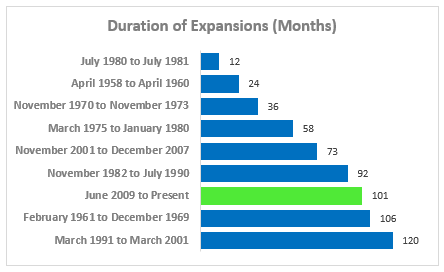
As you can see on Chart 1, the current expansion (highlighted in green) is now the third longest on record, and is on track to overtake the second longest one. In today’s article I will focus on how the stock market performed as we approached the last business cycle peak in December 2007.
Chart 2. Phases of the Business Cycle
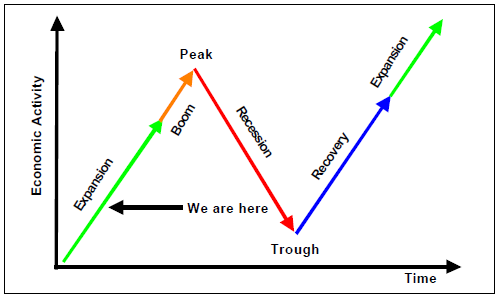
Chart 2 is a schematic diagram of the business cycle. Knowing where you are in the business cycle gives you important information about what to expect now and in the months and years ahead.
Which brings us to the first general concept that underlies this research: “where are we, and how did we get here? “ That knowledge will inform how we interpret information as it becomes known.
The second general concept in this research is: “what did they know and when did they know it? “ or WDTK for short. When doing historical analyses, with the benefit of hindsight, it is often easy to forget that much of what is known to us now was unknown at the time. This is especially true of the analysis of the interaction between variables. So, as we proceed with this review keep in mind that I will be focusing on what was known then rather than what we know now.
I will begin the review of each of the Bear Market events with a chart that covers the peak-to-trough decline. And, as you see in the text that follows, it is here that I will provide you with some of the background about what was going on in the market.
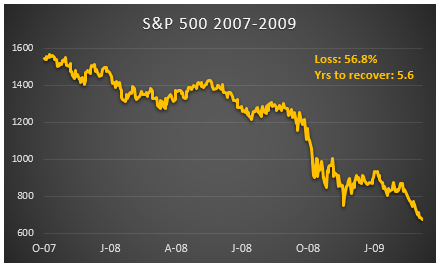
Chart 3. The crash of 2008
Timeline of events leading up to the 2008 bear market
2007: The housing crisis deepens. Banks and hedge funds that invested big in subprime mortgages are left with worthless assets as foreclosures rise. The damage spreads to the top firms on Wall Street.
February: Mortgage giant Freddie Mac says it will no longer buy the most risky subprime loans.
April: Subprime mortgage lender New Century Financial files for bankruptcy-court protection.
July: Investment bank Bear Stearns liquidates two hedge funds that invested in risky securities backed by subprime mortgage loans.
August: American Home Mortgage Investment, which specializes in adjustable-rate mortgages, files for bankruptcy protection.
2008: The U.S. economy is in recession. The crisis in subprime mortgages infects the capital markets and nearly crashes the entire global financial system.
In hindsight it’s easy to say that investors should have seen what was coming, and taken steps to protect their investment portfolios. But they didn’t. As the crisis unfolded, there were repeated assurances from the Fed, the Treasury department, and market experts that it was all “under control” and the smartest thing for investors to do was to “stay the course, ride it out, keep the faith.”
That advice ended up costing investors half of their invested wealth, and it would take them 6 years just to get back to even. There must be a better way to handle bear markets. And there is. The key to this whole mess was the recession. Investors who knew that it was coming had a distinct advantage over those who were in the dark. My recession model told me to warn my clients in October 2007, and so I did. What follows is a description of the signals given by my model, and how I interpreted them.
Anatomy of a recession-forecasting model
My model is based on Bayesian probability theory. I start with an estimate of the probability that a recession will occur within the next 12 months, based on fundamental economic indicators (the Bayesian prior).
Next, I adjust the prior probability based on a set of co-incident indicators that have proven influence over the business cycle. I end up with a final probability (a Bayesian posterior) that gives me the confidence to make a recession call.
It’s important to note that every input to my model is based on facts, not estimates. There is no “voodoo” in the model. Some of the inputs are “lagging,” such as the employment and debt data, but others are “co-incident,” such as market trends, market stress, industrial production, and initial jobless claims.
It’s the nature of Bayesian logic that makes this model so effective in forecasting business cycle turning points. No model is perfect, but an 88% accuracy score is about as good as it gets.
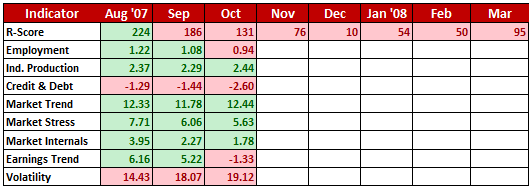
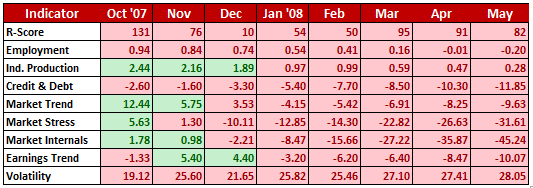
The next table shows a snapshot of the condition of my model in October 2007. It contains clues about the health and direction of the economy, and by extension, the direction of the stock market. It will probably make little sense to you at first glance, but detailed descriptions will follow.
Chart 4. Model Forecast Summary as of October 2007
A brief description of each model input
- R-Score is a combination of the Treasury yield curve, unemployment, and inflation.
- Employment is the % change from 1 yr ago in Private Non-farm Employment.
- Ind. Production is the % change from 1 yr ago in the Index of Industrial Production.
- Credit & Debt is a combination of private & public debt and the Fed Funds rate.
- Market Trend is the YoY % change in the monthly average of daily prices for the S&P 500.
- Market Stress is a combination of market trend and YoY % change in unemployment.
- Market Internals is a combination of price momentum and market breadth.
- Earnings Trend is the YoY % change in reported earnings.
- Volatility is the 3 day moving average of the VIX index.
Looking at chart 4, we see that in August 2007 the model was flashing green, as 7 of the 9 indicators were positive. Then the next month, things deteriorated a bit, as the R-Score flipped from green to red. Then in October, employment and earnings joined the red team. This tipped the balance from a “green board” to a “red board.” It was at that point that I issued a warning to clients that it was time to take evasive action.
Each of my clients has a contingency plan for dealing with recession warnings. Some take measured steps to reduce exposure over time. Others simply bail out of stocks and go into cash or bonds. It’s all a matter of what your risk preferences are.
Next let’s fast-forward to May 2008, where we can see how the model inputs progressed. It should not come as a surprise that things deteriorated quickly after October 2007. This was one of the worst recessions and bear markets in recorded history. It was kind of a no-brainer for the model to see it coming. But other recessions and their bear markets weren’t as obvious to investors. We will explore that in the next article on this topic.
Chart 5. Model Forecast Summary as of May 2008
As important as it was to know when a recession might start, it was even more important to know when a recession might end. I will go into that in more detail in a future article.
Conclusion
Because we had a red board throughout this stock market event, it was clearly time to play defense and protect your portfolio from major losses.
In the next chapter of this series we will move on to the next market event: the Bear Market of 2000-2002. We will continue to build the case for using the link between the stock market and the business cycle to cut risk and boost returns.