
Avoid Bear Markets by Avoiding Recessions
Article highlights
- The worst bear markets are linked to economic recessions
- Playing defense during recessions can sharply boost returns
- Capture 80% of the upside while avoiding 80% of the downside
- This is a rules-based risk management strategy
- It does not require close monitoring or frequent trading
Background
This is the third chapter in a multi-part series on avoiding bear markets. I will publish a 4th part of the series in a week or so, and perhaps even a 5th part after that if necessary. This chapter describes the general features of three recession-linked risk management models that are available commercially. The next chapter will go into the details of how the models work, and how to use them.
In part 1, I discussed the amount of harm that bear markets cause. I looked at previous bear markets in terms of their impact on the only metric that truly matters – purchasing power.
What I found is that most of what has been written about bear markets, especially by industry experts, greatly understates the real harm that these events inflict on an investor. Furthermore, the amount of time it takes to rebuild purchasing power after a large market decline is rarely mentioned by industry experts. They use nominal returns instead of real (after inflation) returns, in their sales pitches.
This downplaying of the impact of bear markets shows up in academic studies, white papers by industry experts, and posts by popular financial bloggers. It is my belief that the industry argument in favor of buy & hold is motivated, at least in part, by the fact that it is in the advisor’s interest. Here’s why.
Buy & hold clients are passive, and don’t ask a lot of questions or make other demands on the advisor’s time. But advisors’ time is finite and that makes it valuable. Therefore, they spend it in the most productive ways. The more time they spend with any given client, the less time they have available for their most important clients. This is known in the industry as the 80-20 rule (Pareto principle). 80% of an advisor’s compensation comes from the top 20% of his clients. It’s a fundamental principle that is taught in every Sales 101 class.
This does not mean that advisors who promote buy & hold are intentionally deceiving their clients. On the contrary, most of the advisors I’ve known and worked with are genuinely trying to do what’s best for their clients. It’s the compensation model that is to blame here, not the individual advisor who must adhere to it.
In part 2, I described in detail an alternative to buy & hold, using a simple moving average strategy (SMA) that is very effective in getting investors out of the market when conditions are deteriorating. That risk management overlay to a buy & hold approach is effective. It enhances returns, while reducing portfolio risk. But the overlay strategy I’m going to describe today is even better.
Part 3. Using the Business Cycle to Avoid Bear Markets
I’m going to go over the details of a strategy that I have been using with clients since 1998. It’s a systematic, rules-based risk management overlay to the traditional buy & hold strategy. This strategy overlay uses recession forecasting to inform the asset allocation mix of your portfolio.
The salient feature of this strategy – reducing equity exposure just prior to business cycle turning points – is both a blessing and a curse. It’s a blessing in that it operates quietly in the background while the buy & hold approach is doing its job. Most years, this risk management overlay will not be called up for duty.
But every 7 or 8 years or so, there will be an economic recession. No amount of micromanaging by the Fed can prevent recessions from happening. (Just ask Alan Greenspan or Ben Bernanke). When the model calls for either the start of a recession, or the end of one, the risk management overlay procedure is invoked.
But this “stealthy” feature can also be a curse. Here’s why. I have found, over a long career coaching and advising clients, that most investors become antsy when nothing is happening with a strategy. This urge for action is a result of the noise coming from the financial media. Open any website or turn on any financial news channel that deals with the stock market, and you’ll see articles and hear pundits that are predicting imminent doom for the market. You’ll also see others who say everything is great and the market will continue going up for the foreseeable future.
Most investors are susceptible to this kind of noise. It’s difficult to ignore, even for a veteran trader like me. Unfortunately, many will succumb to the temptation to bail out of the market prematurely, and stay out for longer than they should. Despite its robust track record, the recession overlay is not that easy to stick to. It takes patience, discipline, and steady nerves. If you have these qualities, it will work perfectly for you. If you’re an action junkie, it probably won’t.
You will see later in this article just how effective this overlay strategy can be. I’ll present actual trades, dates, and returns for buy & hold and three different versions of a recession overlay.
The investor’s dilemma
Retail investors face a dilemma. Would they be better off by simply ignoring bear markets, or should they take steps to reduce the damage that bear markets inflict? The answer depends on how you answer this question: How many times do you want to earn the same dollar?
Consider this: the only way to create real wealth is by increasing your buying power. I calculated the number of months when the stock market made a new, inflation-adjusted high, going all the way back to 1871. I found that out of 1,760 months, only 157 of them created real wealth. That works out to 8.9%. Put differently, a buy & hold investor will spend 91% of his time in a repeating cycle of earning, then losing, and then re-earning the same dollar. One step forward, 9 steps back, if you will.
It’s like spinning his wheels on a muddy, uphill country road. He makes progress, and eventually reaches the top, but he spends most of his time sliding backwards instead of moving forward.
What if he had a way to “skip over” the deepest ruts in the road? He would still spend most of his time sliding backwards, but if he could avoid the worst spots, he would get to the top much faster. For an investor, that means accumulating more buying power in less time. A lot more buying power.
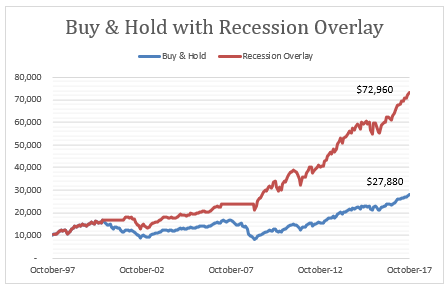
Chart 1. Two ways up the hill
This chart shows the growth of an initial investment of $10,000 over 20 years. The Blue line is the track of a buy & hold approach, which calls for the investor to stay fully invested throughout the period. The Red line is the track of the buy & hold approach when it’s combined with a recession forecasting risk-reduction overlay.
Buy & hold is probably the best strategy for many investors. Maybe even most investors. But not for all investors. People lead busy lives, and many of them are better off using the buy & hold approach. It’s simple to manage and doesn’t take much time away from other priorities. I am not arguing against the idea of buy & hold. I’m arguing that buy & hold is a choice, not the Holy Grail that it’s often made out to be.
To make an informed decision about which of these paths up the hill is best for you, it’s important to know what the facts are. Chart 1 shows what the facts are. Over a 20-year period, buy & hold turns $10,000 into $27,880 dollars. That’s a pretty good reward for very little effort. The advantage of choosing this way up the hill is simplicity and low-maintenance. Set it and forget it. It’s a great strategy for people who are too busy to tinker with their investments, or just aren’t interested in investing at all.
The other way up the hill is to follow the buy & hold path, but when the road gets exceptionally rough, hit the parking brake, and wait for conditions to improve. This will effectively allow you to skip over the bad patch and resume your journey on the other side. It’s not as hard as you might think to pull this off. Bad patches only come along about every 7 or 8 years. But when they do, you really need to pay attention to what you’re doing. This heightened vigilance can continue for several months, or maybe even a year or two. But once the danger begins to fade, you can release the parking brake and go back to buy & hold again.
Recessions can be predicted
Regardless of what you may have been told by finance experts, there are ways to know – with a high degree of confidence – when the economy is getting ready to roll over into a recession. There are several recession-forecasting services that do excellent work in this niche of economics. None are perfect, because the economy is a complex, adaptive system that is notoriously difficult to analyze, let alone forecast.
But predicting business cycle turning points is very different from predicting the rate of economic growth. When an economist forecasts GDP, she must get two things right – the number, and the sign (positive or negative). But when predicting turning points, she only has to get one of these right – the sign. Is GDP growth about to turn negative? And if it’s already negative (currently in a recession), is it about to turn positive? These are the business cycle turning points. They can be anticipated with statistically meaningful accuracy.
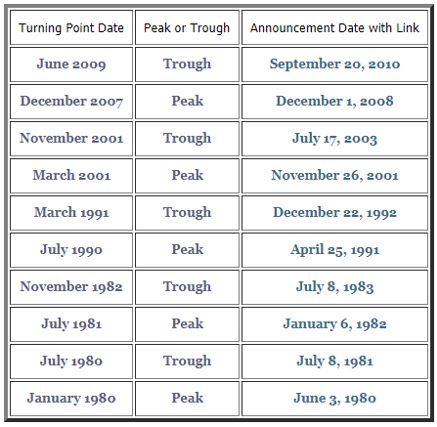
Table 1. Official business cycle turning points from NBER since 1980
Three Risk Management Overlays to a Buy & Hold Strategy
ZenInvestor is a nonprofit investor advocacy firm, so in the interest of giving you multiple options to consider, I will briefly describe two alternative services in addition to my own. I will then present a side-by-side comparison of the performance for each of the three models, over various time frames.
My model, Recession Watch, has correctly called 16 of the last 18 business cycle turning points. It is based on both economic and stock market indicators. The strength of the economy ebbs and flows over time, without tipping over into a recession. To avoid false signals when the economy is weak, the equity indicators act as a confirmation of the economic signals. Here are the indicators I use in the model:
- Treasury yield curve
- Credit conditions
- Employment
- Inflation
- Market Trend
- Market Risk
The second model is called Mr. Model, from NoSpinForecast. This model has correctly called 15 out of the last 18 business cycle turning points. The only drawback of Mr. Model is that its signals tend to be either very early or very late. It will still get you out of the way when a recession is coming, but it doesn’t work as efficiently as it could when it comes to timing accuracy. Here are the model inputs:
- Treasury yield curve
- Employment
- Inflation
- Industrial production
- Private payrolls
- 1-yr return of the S&P 500
The third service is the RFE, from RecessionAlert. It has correctly called 13 of the last 18 turning points. A good track record, to be sure. The model they use is a little more complex than Mr. Model, and the performance is also a little better. Here are the model inputs:
- Employment
- Business outlook
- Manufacturing
- GDP
- CFNAI
- ADS
In addition to the above, they also have five proprietary composite indices.
The “control” model, if you will, is the one that’s published by the National Bureau of Economic Research (NBER). They are the final authority for dating the peaks and troughs of the business cycle. The problem is that it takes them several months, or even longer, to be confident enough in their data to declare that a turning point has happened. By the time they make their declaration, the stock market has already made a substantial move.
Bear in mind as you look at the performance comparisons that follow, that the NBER results are not actually achievable in practice, due to the long lag times involved. But the turning points they identify are the “official” dates. So the NBER model serves two purposes for us. First, it’s the benchmark for measuring how early or late the signals from the other models are, relative to the official turning points. Second, the impact on portfolio returns, while purely theoretical, offer a benchmark for scoring the returns of the other services. Table 1 (shown above) is a summary of the turning points from 1980 to the present.
Conventions used
In order to make the math easy, I used an “all-in” or “all-out” version of this strategy. At any given point, you are either 100% invested in stocks, or 100% invested in cash or T-bills. This is what I consider a “radical” application of the recession overlay, but there are also some “nuanced” applications that can be used with this strategy.
A proactive investor must be prepared to take defensive steps when recession risk is elevated. This additional demand of time and attention is the primary cost of using a proactive approach to managing risk. In exchange for bearing this cost, the reward is getting out of harm’s way when recession is a clear and present danger. Industry experts call this “market timing.” I call it “sensible risk management.”
Market timing has a bad reputation among the investment cognoscenti. That’s because the way it’s practiced by most investors means jumping in and out of the market based on emotional triggers. But there are other, more effective ways to manage risk that don’t involve emotions at all.
The Performance History of Alternative Investment Strategies
The next table shows the actual record of returns from several different strategies, including the 4 risk management overlays to a buy & hold approach.
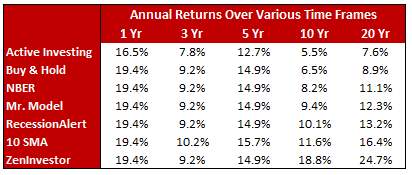
Table 2. Performance track records for the strategies described in this presentation
(See the Appendix at the end of this article for a definition of terms used in the table.)
Performance highlights for Table 2.
The first thing you might notice is that the 1-year returns are identical for all strategies except active investing. Why? Because they are all based on buy & hold, so any time that doesn’t include a recession will show a buy & hold return. Why is active investing underperforming buy & hold? Trading costs, market timing, stock selection, and management fees.
Referring to Table 1, the next thing to look at is the 3-year returns. Here we have some divergence in performance. The recession overlay strategies are still matching buy & hold because there has not been a recession in this period. But the 10 SMA strategy doesn’t consider recessions, so it logged a different return than the others.
When we get to the 5-year returns, the same thing applies. No recession means that these strategies will mimic buy & hold. This is a key point. For many investors, using a strategy that is dormant for five years, especially one that they are paying for, is too much to bear. So they get impatient and bail out. That’s when Murphy’s Law comes into play. No sooner do they bail out, a recession hits the economy.
It’s only when we get to 10-year returns that things begin to get interesting. Since there was a recession in 2008, the strategies that use a recession overlay begin to pull away from buy & hold. This performance advantage, also known as Alpha, starts out strong and gets even stronger. This is partly due to the nature of compounding and partly to the fact that after 20 years, we have two recessions as part of the mix – 2001 and 2008.
Final thoughts
Here’s the takeaway. Anyone who looks closely at Table 1 should be able to see that after 10 years, the recession overlay begins to pay off in spades. And after 20 years and two recessions, it’s clear that avoiding recessions is a powerful performance enhancer. But human nature causes most investors to lose interest in a strategy that is slow to pay off. Attention spans in the age of social media and a 2-hour news cycle are very short indeed. But the race to the top of the hill belongs to the Tortoise, not the Hare.
Appendix – Definition of terms used in Table 2.
Active Investing returns are the returns captured by non-buy & hold investors (stock pickers, fund or ETF pickers, market timers, day traders, etc.).
Buy & Hold returns are the price-only returns for the S&P 500 index.
NBER returns are theoretical. The model is invested in the S&P 500 index, except for months when the U.S. economy is in recession.
Mr. Model returns are based on a rules-based system whereby the model is fully invested in the S&P 500 index, except for months when the model is indicating recession.
RecessionAlert returns are calculated the same way as Mr. Model, but the recession months are slightly different between the two models. The difference in performance is due to differences in the model inputs.
10 SMA returns are the result of moving into and out of the S&P 500 index, based on whether the month-end index price is above or below the 200-day moving average.
ZenInvestor returns are based on buy and sell signals that are generated by a combination of economic indicators and equity market indicators. The economic indicators are the primary signal source, and the equity market indicators either confirm or disconfirm the economic signal. The equity overlay improves the accuracy and timeliness of the model.
See Part 4 of this series here.
Thanks for the great feedback. My recession model is included with all of my trading strategies and my monthly newsletter. You can find all of the services from the main menu.
Very interesting series.
I have been using the strategy detailed in”Asset Dedication” by Huxley and Burns which calls , in the retirement or drawdown phase, for using a fixed income ladder of 5 or more years to provide income, recharging the ladder in good years while allowing the investor to hold his breath and avoid selling stocks during a market pullback. The problem as you point out is that it can take more years than that for themarket to recover.
How can an individual investor gain access to the Zen Investor recession indicator.
Are separate indicator available for other countries or groupings of countries ie EM EAFE ETC.